Consumer Digest: Summer Trends June 2024

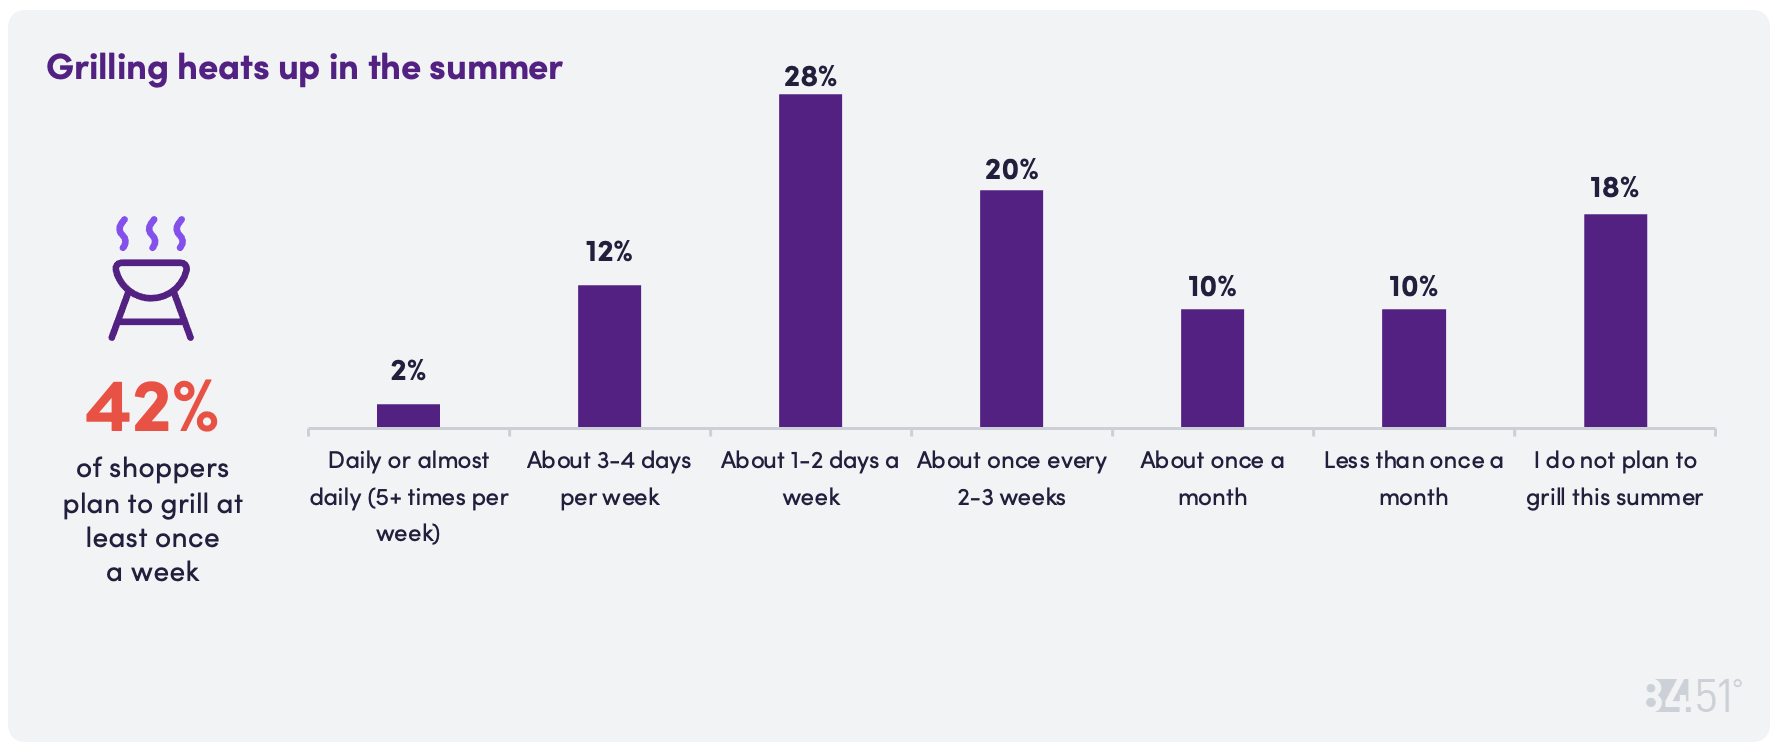
Summer is here, so is the grilling season
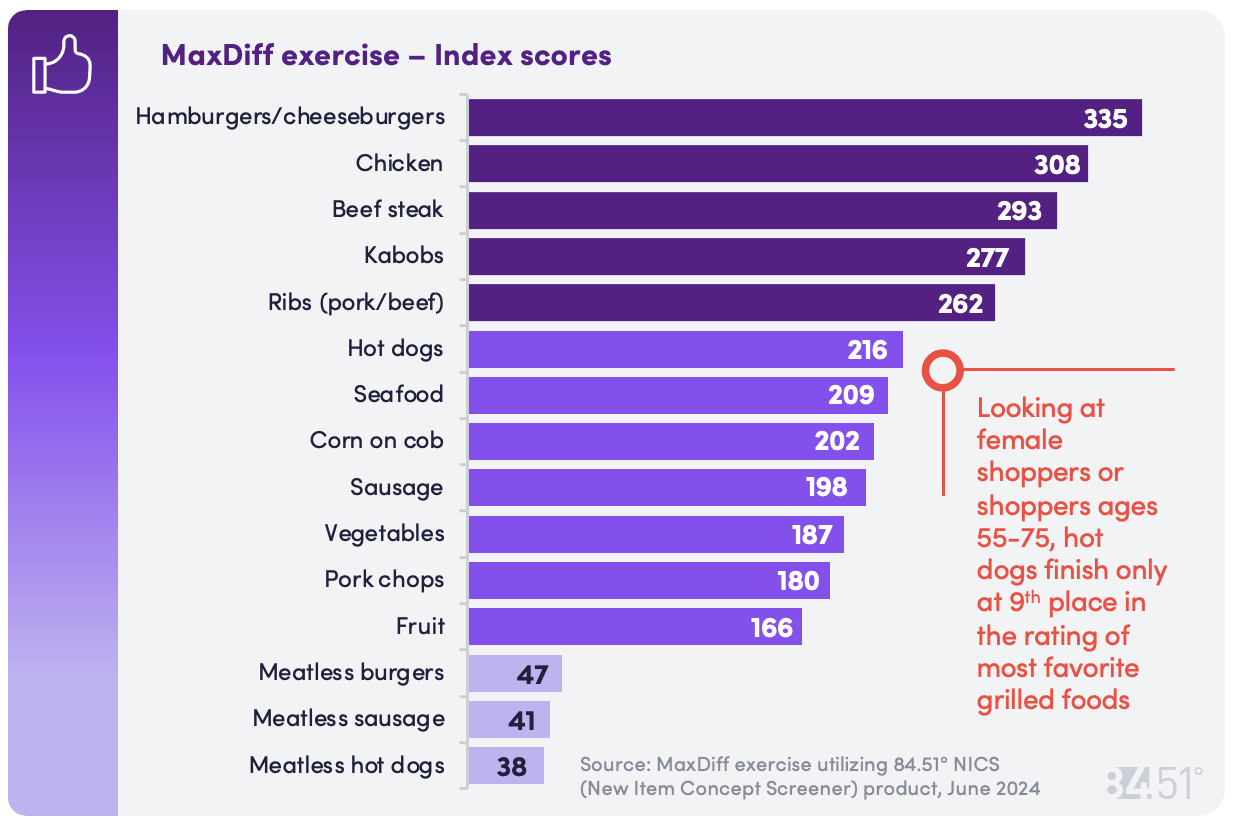
For this June issue, we wanted to learn what shoppers’ favorite grilled foods – and there is no better way to settle the matter than using advanced research techniques.
How MaxDiff works?
We constructed a MaxDiff exercise where shoppers were shown 15 total items, 4 items at a time, and asked to choose their 'Most favorite' and their ‘Least favorite’ of the items shown
This exercise was repeated 12 times to ensure all items were shown in a balanced way
Based on the pattern of responses across all responses to these questions, index scores were calculated
Burgers win the title of favorite grilled food
What do these numbers mean?
An index score is calculated for each item to indicate its level of preference.
Scores reflect a ratio-quality scale, allowing one to conclude, for example, that an item with a score of 200 is twice as likely to be selected as most favorite than an item with a score of 100
When would you use this?
This approach is better at simulating the purchase decision customers make at shelf vs. asking a scaled purchase intent question.
For example, it can be used to evaluate new products, when behavioral data is not available.
Buns are on a roll!
Shoppers purchase a wide variety of bun types, with White, Brioche, Whole wheat, and Potato rising to the top.
White: 61%
Brioche: 34%
Whole wheat: 30%
Potato: 26%
Multigrain: 22%
Sourdough: 21%
Kaiser: 19%
Pretzel: 18%
Everything seasoning: 13%
Low carb: 10%
Gluten free: 6%
Keto: 5%
Other: 4%
Don’t purchase: 4%
How are shoppers preparing for summer fun in the sun?
Spending by category changes seasonally – Shoppers adjust spending by category during the summer months, claiming they’ll spend less on indulgent items, more on fresh & seasonally-relevant items, and the same on staples.
I plan to spend less:
Snacks/Candy: 46%
Fresh Bakery: 31%
Ice Cream/Frozen Novelties: 31%
Beauty (e.g., hair products, makeup, etc.): 28%
No change in spending:
Paper products: (e.g., toilet paper, tissues, etc.): 75%
Dairy (e.g., milk, cheese, etc.): 73%
Household cleaning (e.g., surface cleaners, etc.): 72%
Shelf-stable (e.g., canned goods, pasta, etc.): 69%
I plan to spend more:
Fresh produce: 38%
Sunscreen: 32%
Ice Cream/Frozen Novelties: 32%
Drinks (e.g., soft drinks, juices, etc.): 26%
Fresh Produce is in the basket
Shoppers cite the following reasons for purchasing more fresh produce in the summer:
Fresh seasonal produce is more readily available: 70%
Produce is fresher: 57%
The variety of fresh produce is better: 55%
Fresh produce tastes better: 49%
There are more occasions to consume fresh produce: 40%
Fresh produce is less expensive: 40%
Functional Beverages
A functional beverage is a drink that provides additional health benefits. These benefits can include added vitamins, minerals, antioxidants, probiotics, or other nutritional supplements. Some functional beverages may also contain ingredients that boost energy, enhance focus, or aid in weight loss. Examples include fortified water, energy drinks, protein shakes, etc.
87% of shoppers surveyed claim to consume Functional Beverages
Juices: 56%
Sports drinks: 44%
Protein drinks: 35%
Water enhancers: 34%
Energy drinks: 27%
Antioxidant enhanced beverages (e.g., soda, water, etc.): 23%
Digestive health beverages: (e.g., soda with probiotics, etc.): 15%
Wellness shots: 5%
CBD/THC infused drinks: 4%
What product attributes are most important when purchasing a functional beverage product? (T2B)
Tastes great: 83%
Offered at a fair price: 72%
Make with high quality ingredients: 60%
Has clear information on the package: 58%
Top benefits motivating shoppers to consume functional beverages:
Hydration: 74%
Source of vitamins: 44%
Energy boost: 37%
Source of protein: 34%
Convenience: 30%
Non-Alcoholic Beverages
A Non-Alcoholic beverage is a drink that mimics the flavor and experience of traditional alcoholic beverages such as beer, wine, tequila, etc. but contain no or very minimal alcohol content.
23% of shoppers surveyed claim to consume Non-alcoholic beverages. Of those 23% consuming NA beverages, NA spirits and Bitters are least consumed.
Mocktails: 65%
Non-alcoholic beer: 35%
Non-alcoholic wine: 17%
Non-alcoholic champagne: 13%
Non-alcoholic tequila: 9%
Other: 9%
Non-alcoholic gin: 4%
Non-alcoholic whiskey: 4%
Non-alcoholic rum: 4%
Bitters: 4%
“Say” vs. “Do”
32% of NA Beverage consumers say they are consuming MORE.
54% of NA Beverage consumers say they are consuming the same amount.
14% of NA Beverage consumers say they are consuming less.
SOURCE: 84.51° Real Time Insights, June 2024
Visit our knowledge hub
See what you can learn from our latest posts.


![[DO NOT DELETE] 8451-PR header 4000x2000 shutterstock 2146084959 po](https://images.ctfassets.net/c23k8ps4z1xm/CUmZcselsJUhnLz6rQuj2/0e48394e72423bb1073bf8bb6cf75974/8451-PR_header_4000x2000_shutterstock_2146084959_po.jpg?w=328&h=232&fit=fill)