
Consumer Digest: Path to Purchase Insights July 2023

Welcome to the July edition of the Consumer Digest, where we aim to provide relevant informative and actionable insights around consumer trends. This month, we are focusing on consumer’s path to purchase and their key decision points. We look at what items shoppers are most likely to decide on purchasing before they shop and what items shoppers are most likely to purchase on impulse. We’ll also examine “how” consumers shop and their top-ranked promotion preferences. Finally, we’ll wrap up with what’s in shoppers' baskets this summer.
The concern over rising prices is dropping
Shopper’s concern over inflation is at its lowest we’ve seen in the past 12 months at 61%.
This is down 10% YoY.
How shoppers are feeling about their finances
While more shoppers state they are not comfortable (26%) vs. being very comfortable (14%), the majority feel neutral (62%) – a claim that we’re continuing to see month over month.
Shoppers without kids in the household report to be extremely uncomfortable (B2B 31%) about finances, yet only 22% of those with kids in the household are reporting the same level of discomfort over finances.
No more egg jokes – where consumers notice price increases
Compared to six months ago, two of the top three categories are showing positive dynamics; fewer shoppers report noticing price increases in dairy and meat/fish compared to past year average.
More shoppers notice price increases in drinks, while produce, frozen foods, and paper products trended flat.
Pickup is picking up!
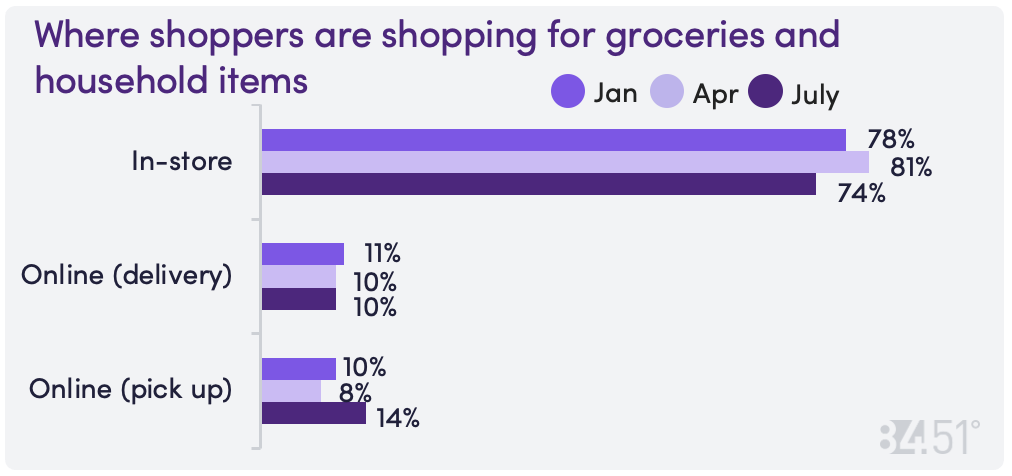
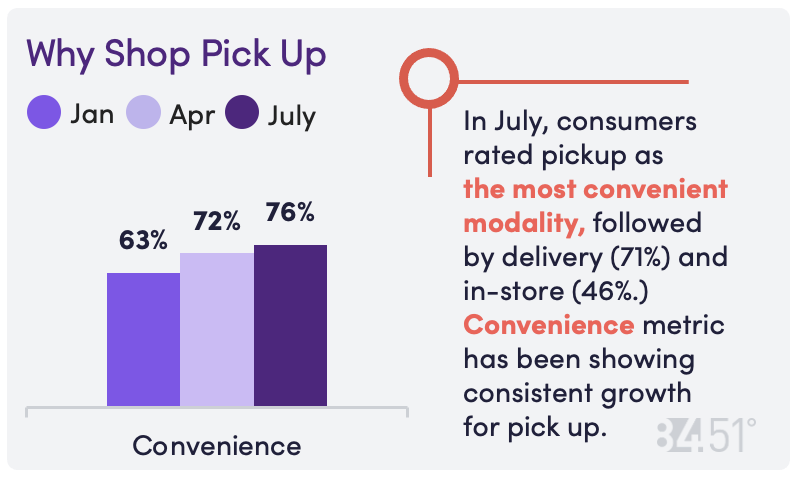
While the majority of shoppers plan to shop in-store in the upcoming months, pickup showed notable growth over the past quarter (from 8% in April to 14% in July).
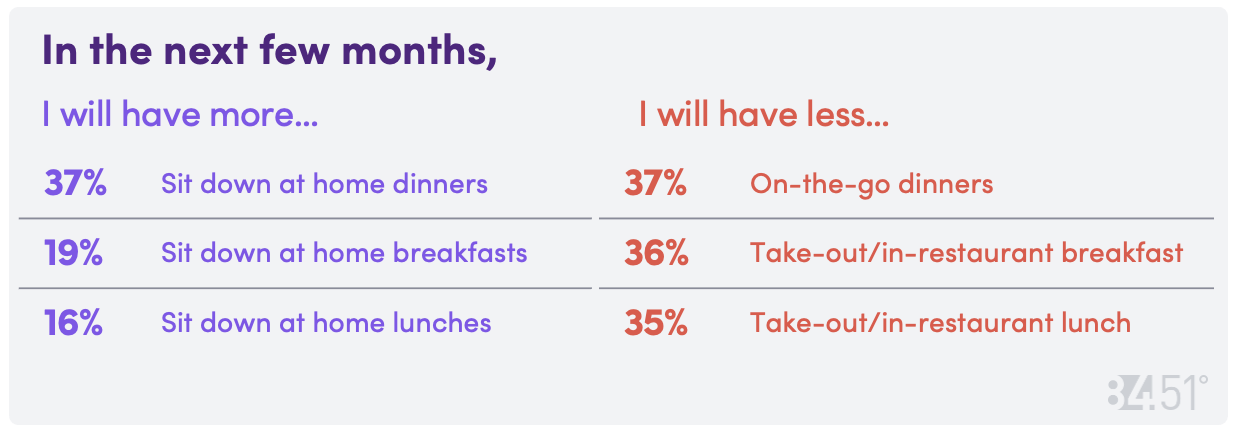
It’s time to slow down and gather around the table
Planned vs. impulse items – when is the decision made?
The sugar factor – When shopping in-store, customers usually decide to purchase non-edible staples within personal care and cleaning before they shop, while snacking, bakery and ice cream tend to be purchased during their grocery trip.
Planned: Items that shoppers are most likely to decide on purchasing before they shop:
76% Paper Products (toilet paper, tissues, paper towels, etc.)
75% Personal care (toothpaste, soap, etc.)
74% Household cleaning (dish soaps, cleaners, detergents, air fresheners, etc.)
73% Health care (over the counter medications, vitamins, first aid, etc.)
72% Dairy (milk, cheese, etc.)
Impulse: Items that shoppers are most likely to decide to purchase during their shopping trip:
45% Produce
60% Ice Cream/Novelties
63% Fresh Bakery
67% Snacks/Candy
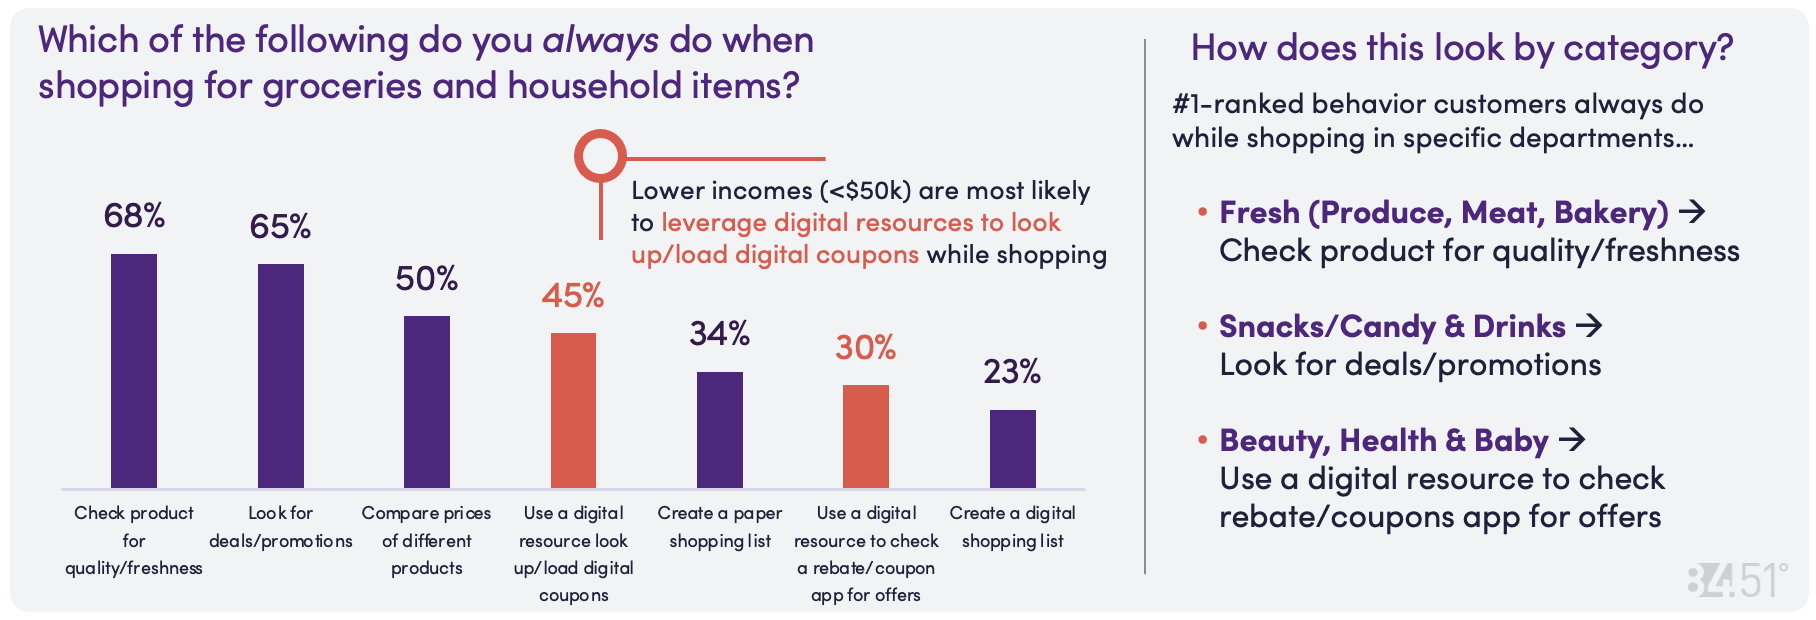
What customers say they “always” do while shopping
Top promotions valued by households
Shoppers are divided in what promotions they prefer most – 17% of shoppers ranked digital coupons lowest on their list (B2B).
Digital coupons are leveraged most when shopping perimeter categories (i.e., Produce, Dairy, Meat/Seafood) while threshold events and end caps are used most often when shopping center store (i.e., Shelf-stable, Drinks & Snacks/Candy).
Lower income shoppers cited digital promotions as top ways to save money, while higher income shoppers gravitate towards threshold events.
When it comes to threshold events (i.e., Spend X, Save X), the most popular is “Spend $15, Save $5” (this is especially true for younger shoppers).
Summer Sizzlers
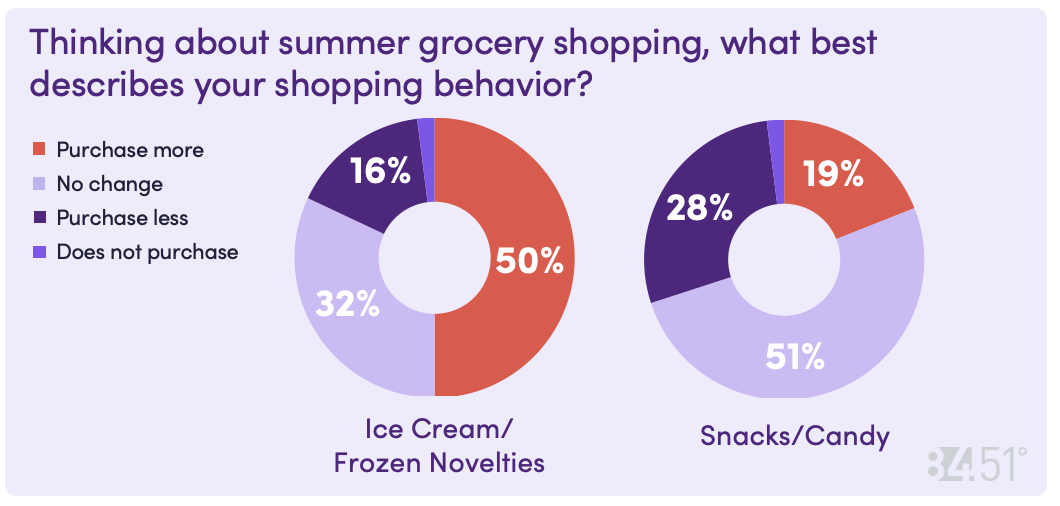
What’s cooking! Nearly 80% of shoppers say burgers are a summer favorite, selecting it as one of their preferred foods to grill this season. Chicken, Steak, and Hot Dogs are other top crowd pleasers. Shoppers ages 35-44 years old are engaging more heavily with meatless versus any other age group (28%).
Summer spending
Back to school – Oh no, [or yeah]!
42% of shoppers haven’t started back-to-school shopping, and 14% have begun. Back- to-school shopping doesn’t apply to the remaining 44%.
Broadly we see shoppers make purchases across multiple retailers for back-to-school supplies with the most common destination being Mass Retailers
More than half of shoppers said they do not purchase back to school supplies from drug stores (i.e., CVS, Walgreens) or club stores (i.e., Sam’s, Costco).
Since 35% of households expect to eat out less once school is back in session, more food is needed at home. Specifically, 41% plan to prepare more meals ahead of time, 30% plan to purchase more pre-made meals, fruits and vegetables.
Want to dig deeper?
Each month. 84.51°’s Consumer Digest Report delivers relevant and actionable insights around consumer trends directly to your inbox. Now, for an incremental investment, 84.51° invites you to explore these insights the way you want via the 84.51° Consumer Digest Dashboard.
SOURCE: 84.51° Real Time Insights, July 2023
Visit our knowledge hub
See what you can learn from our latest posts.




![[DO NOT DELETE] 8451-PR header 4000x2000 shutterstock 2146084959 po](https://images.ctfassets.net/c23k8ps4z1xm/CUmZcselsJUhnLz6rQuj2/0e48394e72423bb1073bf8bb6cf75974/8451-PR_header_4000x2000_shutterstock_2146084959_po.jpg?w=328&h=232&fit=fill)