Consumer Digest: New Year’s Resolutions January 2025

Starting Fresh in the New Year
Resolutions setting in 2025?
Yes: 35%
No, I never set New Year’s Resolutions: 30%
No, not this year, but I have in years past: 24%
Not yet, but I’m planning to: 11%
Top New Year’s Resolution themes:
Physical health: 75%
Personal finances: 52%
Emotional wellbeing: 47%
Top 5 sources of resolution inspiration:
Personal reflection
Friends and family
Social media
Religious practices
Current events or social issues
Top 3 category spending shifts based on resolutions:
Spending more:
Savings/Investments: 52%
Travel: 27%
Supplements: 23%
Spending less:
Dining out/Carry out: 63%
Outside of home entertainment: 45%
At home entertainment: 39%
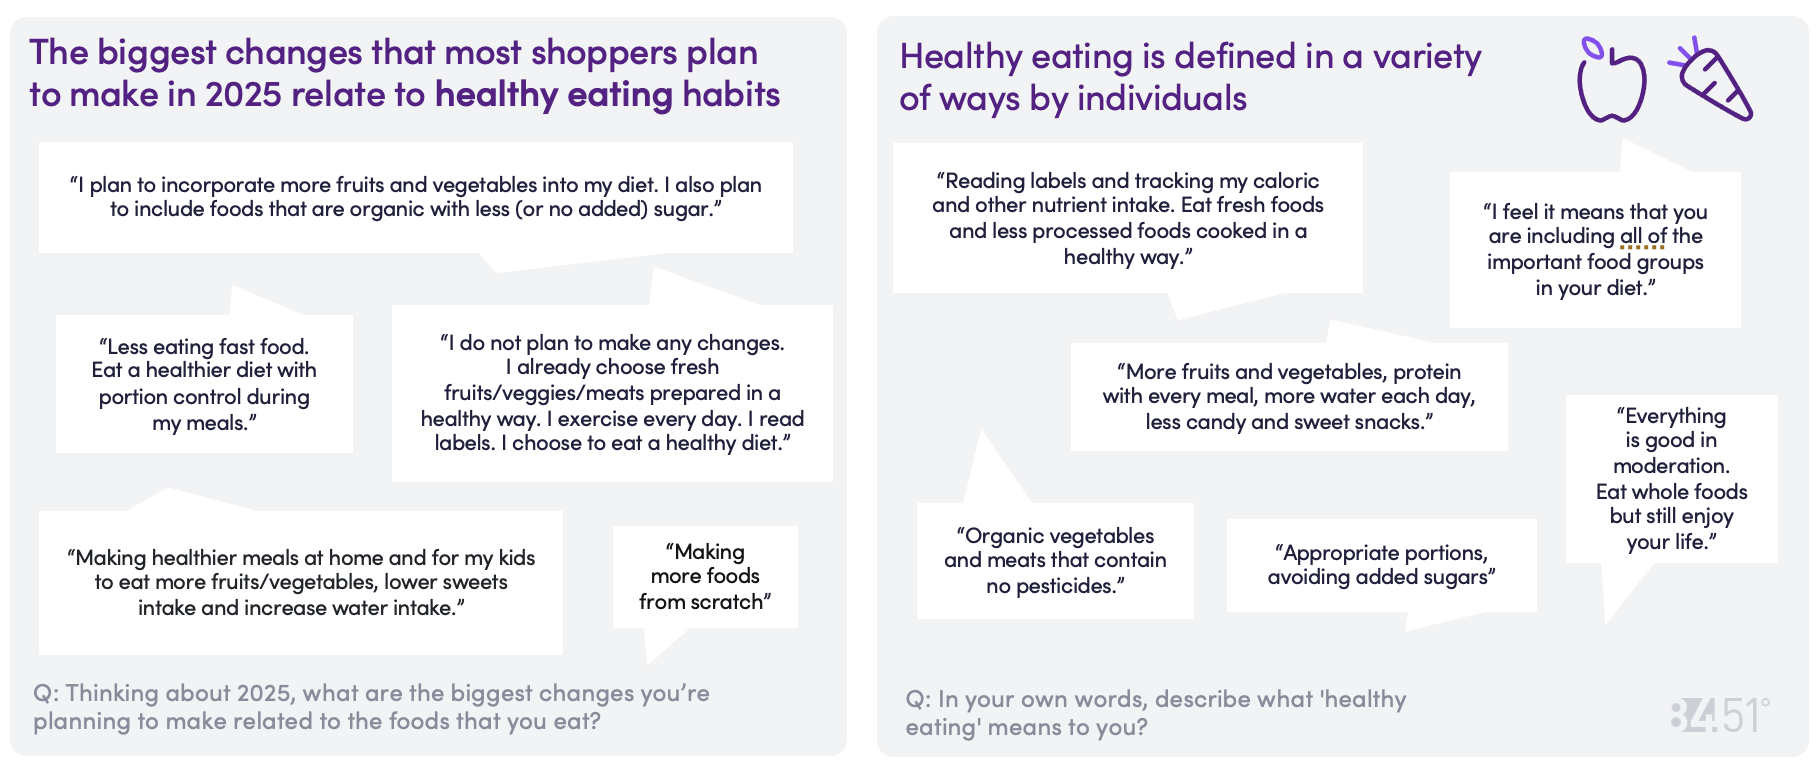
Consumers look to adjust their diet entering 2025
Cost is the #1 influencer when it comes to what shoppers decide to eat and is the biggest challenge for healthy eating.
Top 5 variables contributing to shoppers’ eating decisions:
Food costs: 73%
Foods that are available where I shop for groceries: 53%
Time required to prepare food: 44%
Recommendations from friends and family: 22%
Ability to eat on the go: 18%
Top 5 challenges shoppers face when it comes to healthy eating:
Food costs: 36%
Finding healthy options that taste good: 13%
Lack of time: 12%
Finding healthy options that fill me up: 9%
Knowing which foods to eat: 7%
Shoppers plan to use a variety of strategies to accomplish their health goals in 2025:
Eat more fruits and vegetables: 66%
Stay hydrated: 63%
Cook more meals at home: 54%
Limit processed foods (i.e. clean eating): 51%
Portion control: 49%
Limit added sugars: 49%
Healthier snacking: 49%
Eat more protein: 47%
Balanced diet: 40%
Eat more fiber: 33%
Plan meals ahead of time: 31%
Pay more attention to food labels: 28%
Eat more whole grains: 21%
Work with a dietician or nutritionist: 6%
While many shoppers do not use any resources to manage their eating habits, the top management techniques among those who do are:
Meal planning and or diet planning: 32%
Scale (measuring body weight): 30%
Fitness tracker (i.e. Fitbit, Garmin): 30%
Mobile app: 28%
Food diary or journal: 20%
Dietician or nutritionist: 20%
Smartwatch (i.e. Apple, Samsung): 19%
Website: 16%
Smart kitchen appliances: 6%
AI recommended meal plans and advice: 5%
I don’t use anything to manage my eating habits: 36%
Food as Medicine
Managing weight, heart health and energy are the most common concerns across all ages (T2B).
“Fresh” is the main form of fruits and vegetables shoppers look to purchase
Fresh vegetables: 88%
Fresh fruits: 86%
Frozen vegetables: 64%
Pre-cut fresh vegetables (includes bagged salads): 51%
Shelf-stable vegetables (i.e. canned): 48%
Shelf-stable fruits (i.e. canned, jars, cups): 37%
Frozen fruits: 34%
Pre-cut fresh fruits: 27%
None of the above: 3%
The following inspire trial of new fruits and vegetables- though 13% of shoppers say nothing will get them to try new fruits and veggies.
In-store sampling or tasting stations: 52%
Recipe suggestions: 48%
In-store signage: 22%
Social media posts: 15%
Retailer drivers: Price, assortment, freshness and availability of produce are the main reasons shoppers choose where to shop (T2B).
Offers affordable prices on fruits and vegetables: 76%
Has a good selection of fresh fruits and vegetables: 73%
Products remain fresh for an acceptable amount of time: 69%
Fruits and vegetables are consistently in-stock: 66%
Has a good selection of shelf-stable fruits and vegetables: 45%
Has a good selection of frozen fruits and vegetables: 41%
Has a good selection of pre-cut fresh fruits and vegetables: 35%
Has a good selection of organic fruits and vegetables: 32%
Carries unique fruits and vegetables: 27%
Employees are knowledgeable about fruits and vegetables: 21%
Drugs used for weight loss have gained traction among shoppers in the past year:
24% of Kroger Shoppers are very familiar with GLP-1 drugs to support weight loss (T2B).
18% of Kroger Shoppers are very interested in GLP-1 drugs to support weight loss compared to 17% in 2024 (T2B).
Showing the LOVE on Valentine’s Day…
Who are you buying for?
Children: 35%
Spouse: 34%
Significant other: 17%
Myself: 9%
Other Relatives (e.g., Parents, Grandparents, etc.): 9%
Friends: 7%
My pet(s): 7%
I do not plan to celebrate Valentine's Day this year: 30%
Valentine’s Day gift inspiration:
Physical mass retail store: 53%
Online search: 36%
Grocery store: 33%
More shoppers plan to purchase less expensive, simple gifts for Valentine’s Day vs. more expensive, involved purchases.
Chocolates: 62%
Cards: 43%
Dinner out: 33%
Flowers: 30%
Personalized items: 30%
Experience (e.g. trip, event, class): 13%
Jewelry: 9%
Spa or wellness items: 8%
Luxury items: 6%
Source: 84.51° Real Time Insights, January 2025
Visit our knowledge hub
See what you can learn from our latest posts.


![[DO NOT DELETE] 8451-PR header 4000x2000 shutterstock 2146084959 po](https://images.ctfassets.net/c23k8ps4z1xm/CUmZcselsJUhnLz6rQuj2/0e48394e72423bb1073bf8bb6cf75974/8451-PR_header_4000x2000_shutterstock_2146084959_po.jpg?w=328&h=232&fit=fill)