Consumer Digest: March 2023

Welcome to the March edition of the Consumer Digest, where we aim to provide relevant, informative and actionable insights around consumer trends. This month, spring is in the air! We’re focusing on how consumers are thinking about spring cleaning – what they are buying and where. We’ll also look at shopping patterns for health, beauty, and personal care products. Finally, we’ll see how consumers are planning to partake in upcoming spring celebrations.
Contagious disease concern trending down!
We’re seeing an overall decline with shopper concern over contagious diseases and viruses since tracking this concern from January of this year.
Those ages 65-74 are significantly more concerned than those ages 25-44
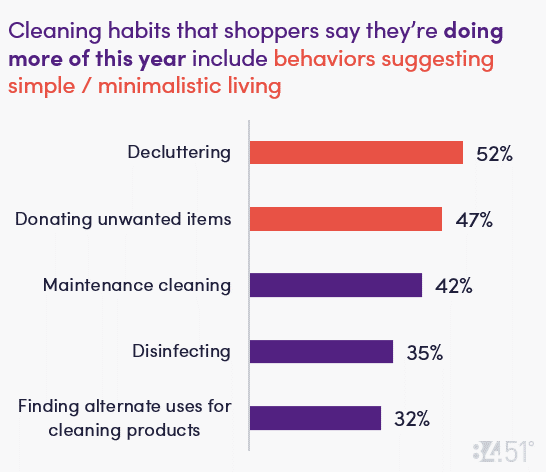
Almost all shoppers are planning to participate in spring cleaning this year, and most have either already started or are planning to start in April. Households are more likely to purchase infrequently-used cleaning items for spring cleaning, whereas everyday cleaning supplies are more likely to already be in shoppers’ homes.
34% of shoppers have already started spring cleaning, 20% plan to start in March, and 36% plan to start in April.
Shoppers ages 35-44 are most likely to have already started.
Most shoppers purchase cleaning products/supplies at multiple retailers.
Households with kids are more likely to do spring cleaning (95%) than Households without kids (85%).
Which of the following do you plan to clean more of in the spring?
Windows (57%)
Refrigerator (52%)
Bathroom shower (48%)
Bedroom (47%)
Baseboards (45%)
Oven/Stove (43%)
Already on-hand (Items most likely to already have and plan to use this spring)
Laundry detergent (81%)
Liquid dish soap (81%)
Trash bags (80%)
Glass cleaner (79%)
On the shopping list (Items most likely to purchase this spring)
Oven cleaner (27%)
Floor/carpet Cleaners (26%)
Air care (25%)
Drain cleaner (22%)
The biggest pain point shoppers cite when it comes to cleaning is the time it takes to clean (64%), followed by the price of cleaning products / supplies (39%), things not getting completely clean (38%) and disliking cleaning (38%).
Activities that shoppers do most to guard against germs/dirt include washing their hands regularly (80%), sanitizing surfaces (71%) and changing their A/C filters (63%).
Top 5 Most Important Cleaning Product Attributes
Gets the item cleaned (81%)
Has alternative uses (72%)
Kills Germs/bacteria (69%)
Available at preferred retailer (67%)
Good value for the money (67%)
Safe to use around kids/pets (64%)
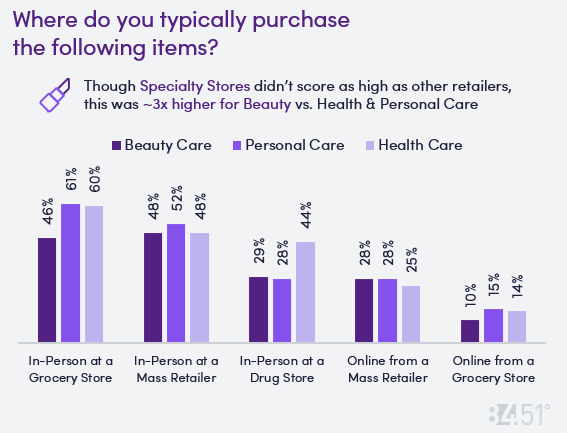
When choosing where to shop for health, beauty, & personal care items, shoppers typically browse in-person at grocery, mass, or drug stores, and top factors driving retailer choice include price and product standards.
What factors are most important in choosing where to buy beauty, personal care, & health care items?
Price (72%)
Product meets my standards (60%)
Convenience (53%)
Location of retailer (51%)
Sales/promotions (50%)
Brand availability (45%)
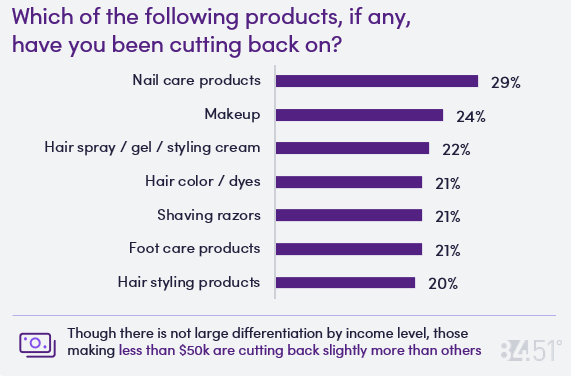
32% of shoppers are not cutting back on any health, beauty, & personal care products.
If shoppers are cutting back on these products, top reasons include the item being too expensive, not using the item as frequently, not using the item at all anymore, or already having enough of the item on hand.
67% of shoppers are not splurging on health, beauty, & personal care products.
Of those who are splurging, 11% have spent more time on health/beauty care, 10% are purchasing more self-care items, and 9% are purchasing more natural/organic items.
The majority of Easter shopping is happening in-person at a grocery store, in-person at a mass retailer, or online from a mass retailer.
Most shoppers will make food at home for Easter meals, though in second place is eating at the homes of family/friends.
48% will not celebrate St. Patrick’s Day, but those who do will wear green (34%), drink adult beverages (20%), and eat Irish Foods (19%).
March Madness: 29% will watch these games at home and 15% fill out a bracket. 58% say they will not partake in any “madness.”
What will you buy for Easter?
Chocolate (55%)
Easter-theme candy (39%)
Fruit-flavored & sugar candy (37%)
Peeps (22%)
SOURCE: 84.51° Real Time Insights, March 2023
Visit our knowledge hub
See what you can learn from our latest posts.
