Consumer Digest: Loyalty Insights August 2024

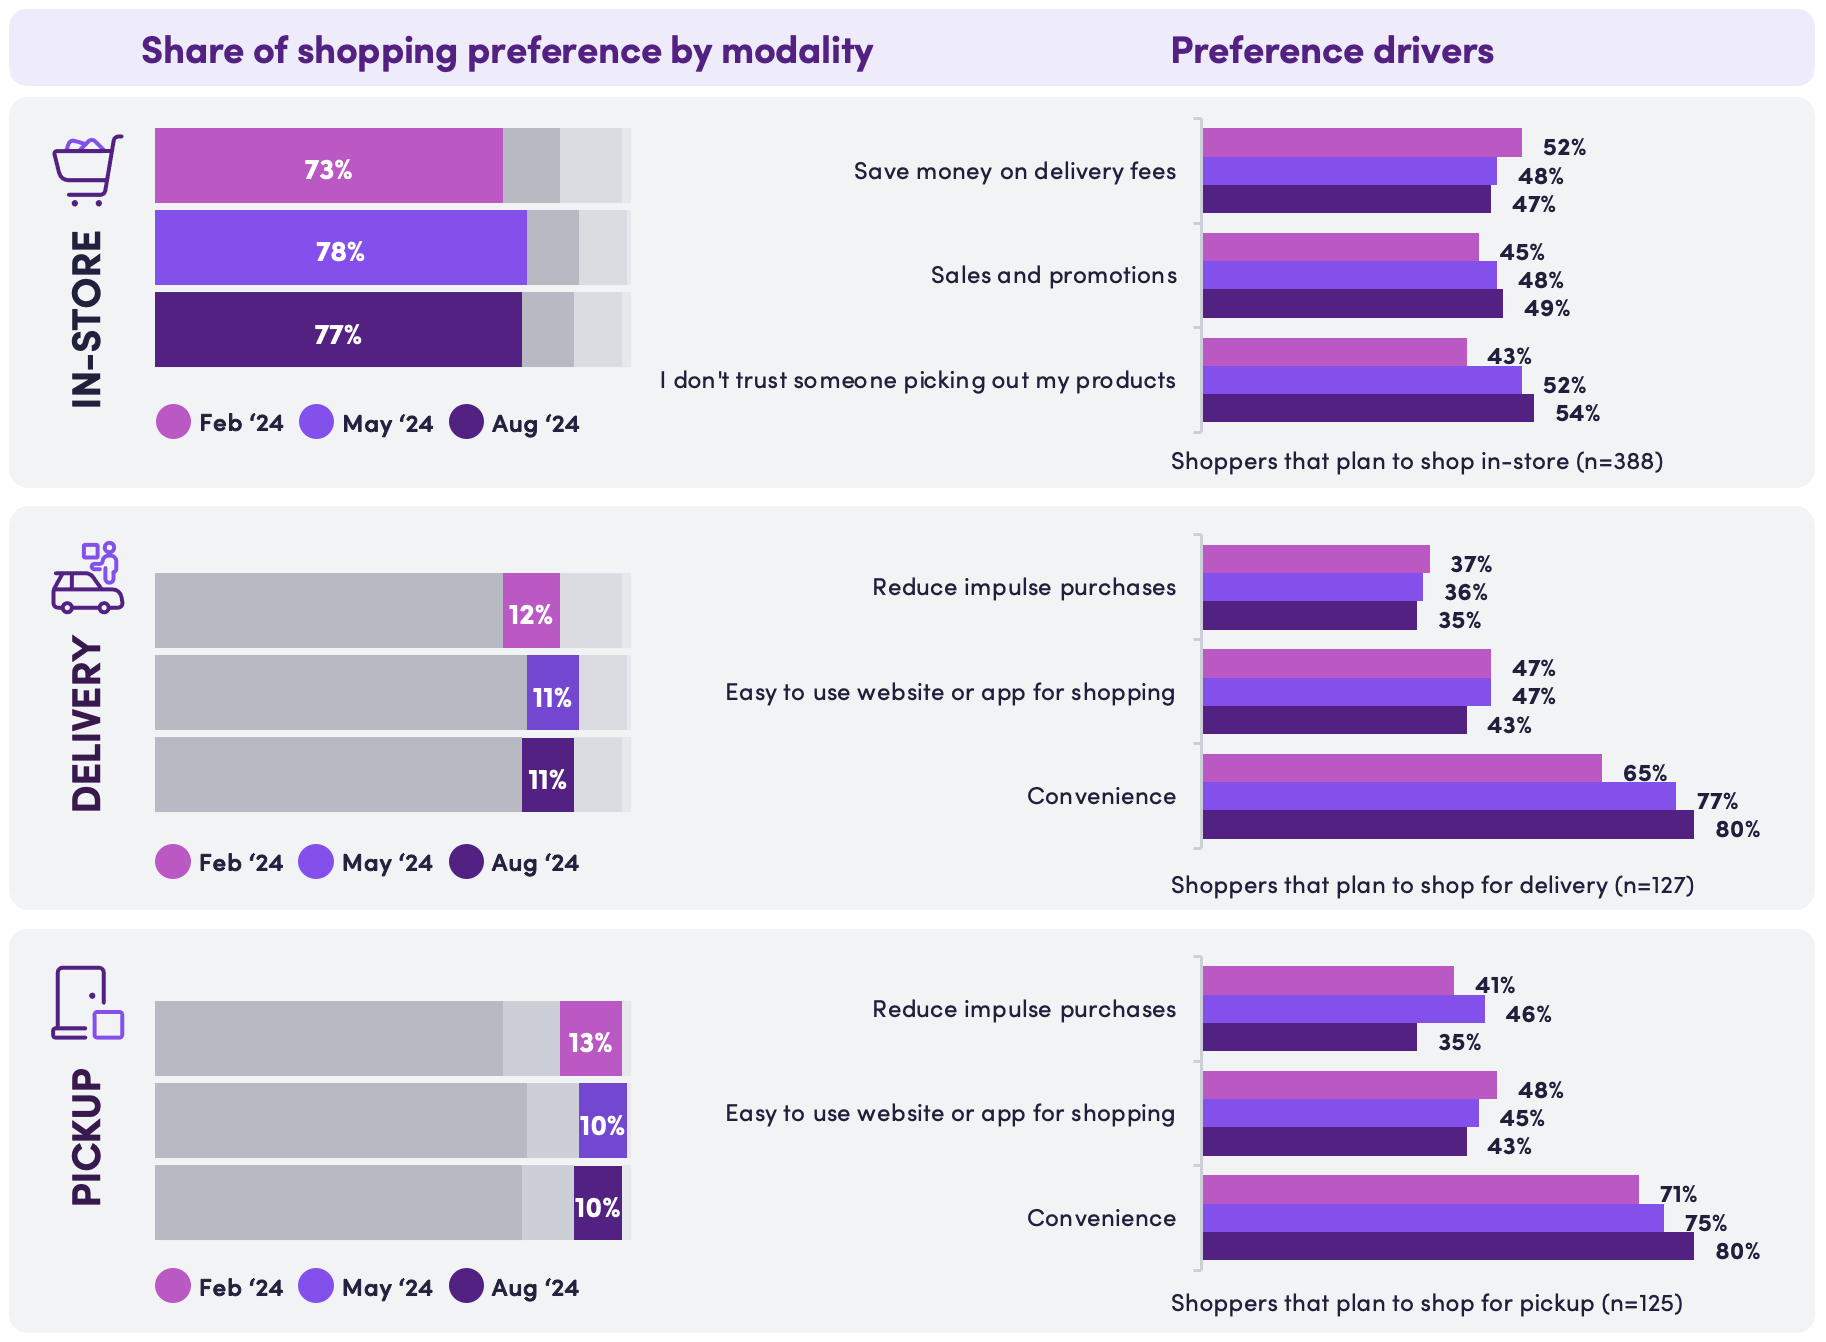
What is driving shopping modalities?
Over the past three quarters, we asked shoppers to share how they plan to split up their shopping between the three modalities and why. Those that have a preference for delivery or pick up are much more driven by convenience, compared to the beginning of the year.
Retailer websites or apps and social media are the best bet for connecting with consumers through providing grocery list inspiration
Where shoppers draw inspiration for their grocery lists:
Retailer website or app: 37%
Social media: 28%
Cookbooks: 25%
Retailer email communications: 20%
Blogs or websites: 16%
Consumer goods brand website or app: 15%
Video streaming or TV programming: 13%
Brand email communications: 12%
AI/Chat GPT: 3%
None of the above: 29%
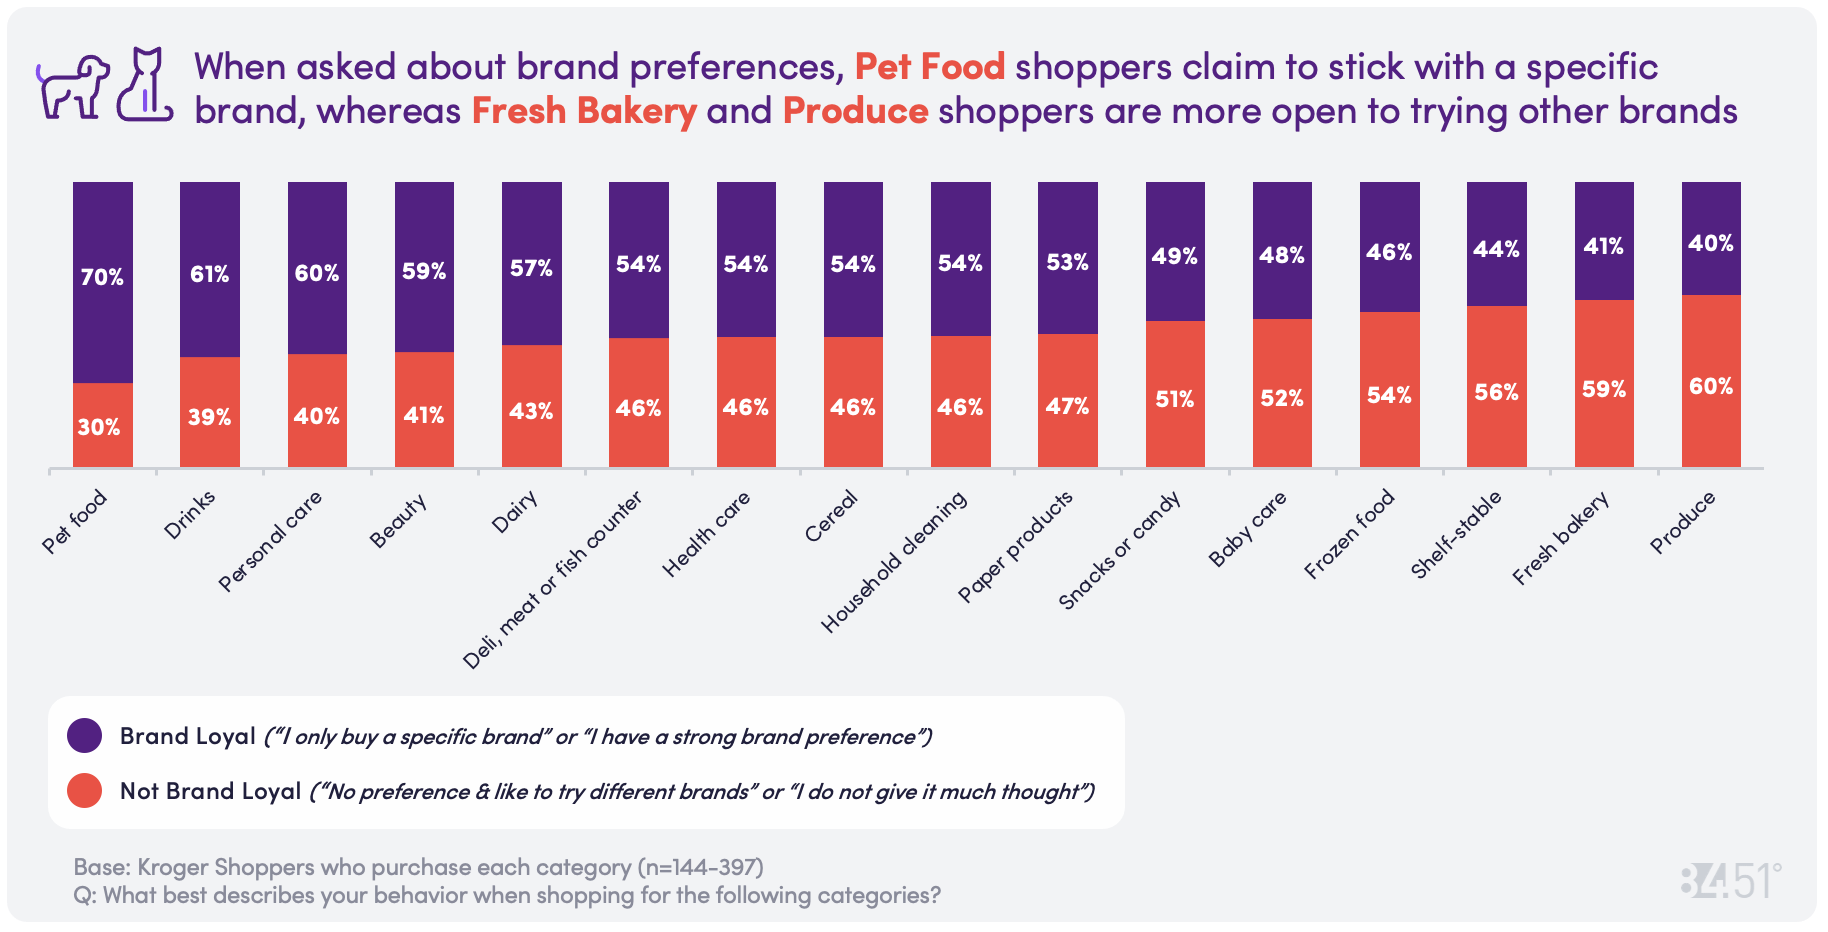
Say vs. Do: While Shelf-Stable shoppers claim to be less brand loyal and more willing to switch, they only purchase an average of 1.5% of brands available to them.
Shoppers are least willing to compromise when it comes to shopping for babies and pets.
(% indicate willingness to switch to a lower cost brand)
Paper products: 62%
Shelf-stable goods: 59%
Household cleaning: 52%
Frozen food: 49%
Dairy: 48%
Cereal: 47%
Drinks: 46%
Personal care: 37%
Deli, meat or fish counter: 33%
Fresh bakery: 32%
Produce: 32%
Beauty: 30%
Pet food: 25%
Baby care: 21%
Brand loyalty looks different in each aisle
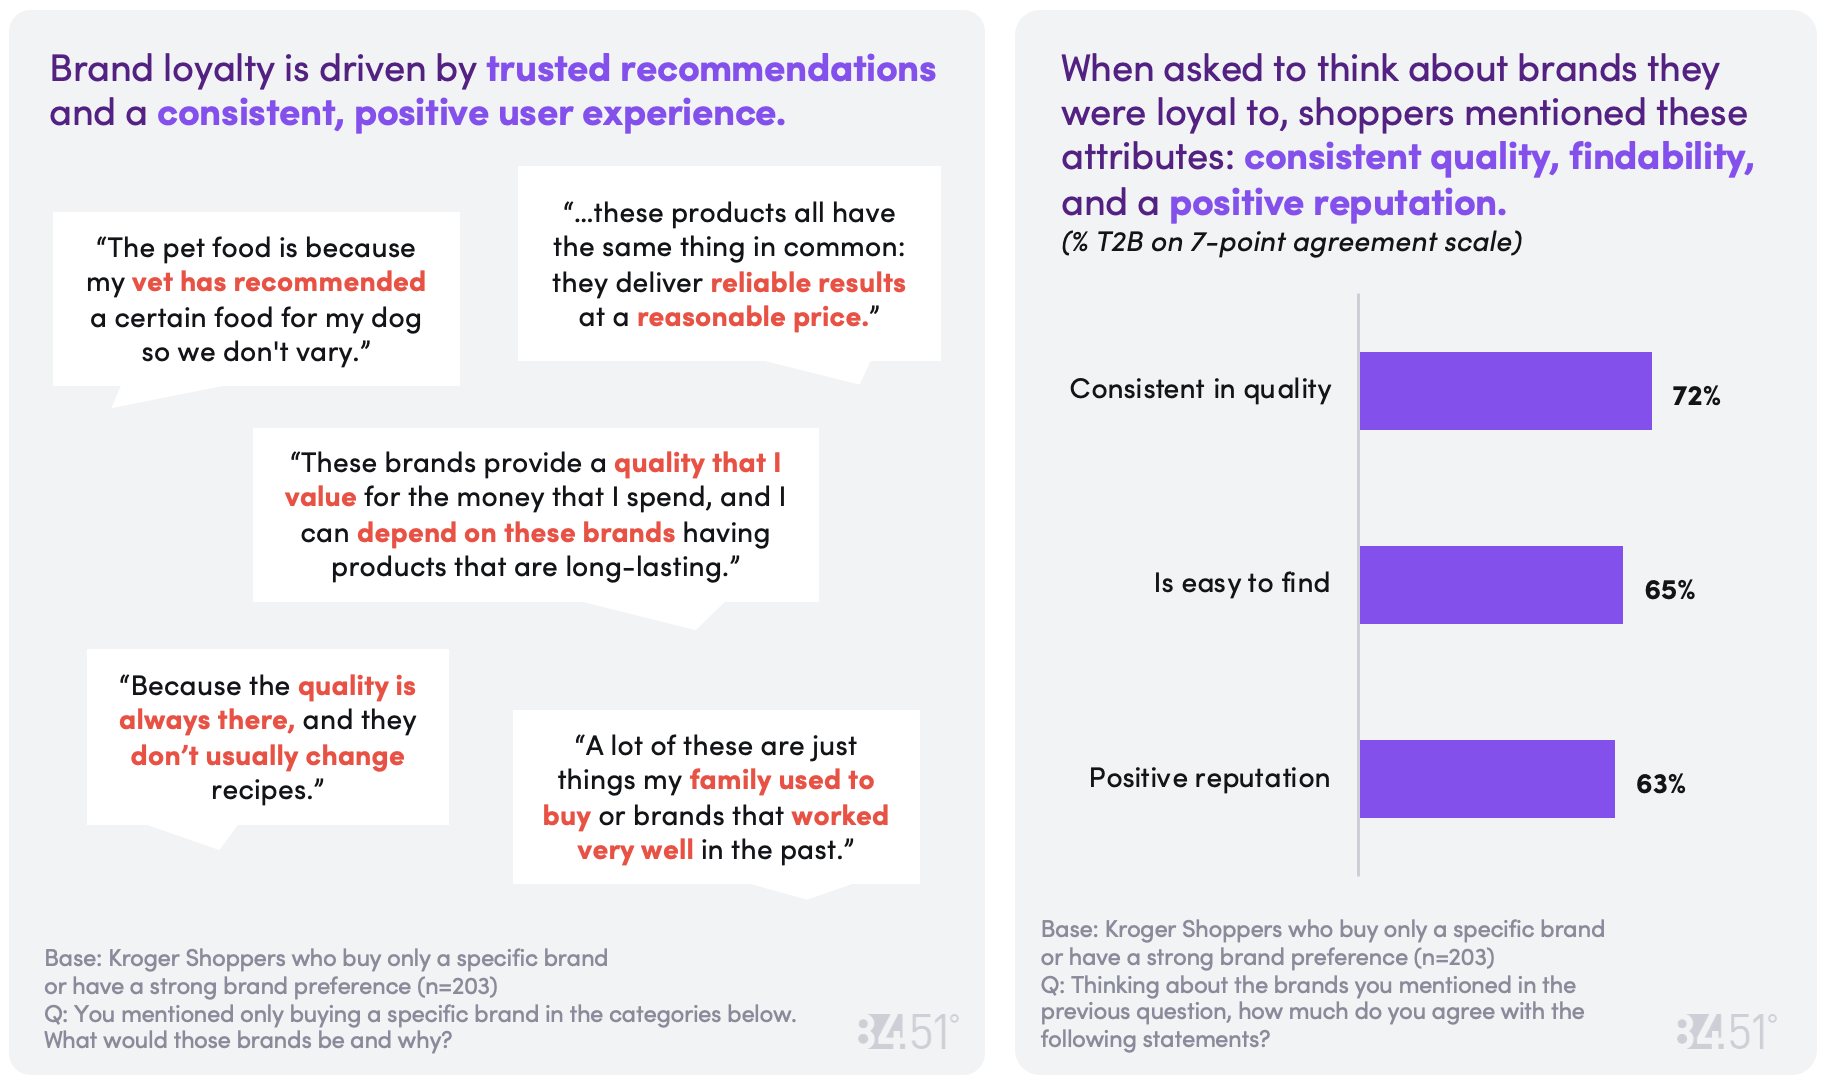
How do consumers define brand loyalty?
Shoppers tend to think of purchase consistency when they think of brand loyalty
The brand I buy most often: 60%
The brand I buy exclusively: 16%
The brand I want to buy the most: 12%
My preferred brand, but I am willing to try others: 12%
Value and Trust are the top drivers of brand loyalty, followed by having sufficient varieties and sizes.
Good value for the money: 84%
Brand I trust: 56%
Comes in the varieties I want: 51%
Comes in the sizes I want: 49%
Relevant to me: 33%
Offers personalized rewards: 25%
Meets my dietary needs: 23%
Delivers on its promise(s): 18%
Helps me meet my personal goals: 13%
Brand cares about the environment: 11%
How do consumers define retailer loyalty?
Shoppers tend to think of purchase consistency when they think of retailer loyalty.
Retailer I shop most often: 63%
Preferred Retailer, but open to shop others: 16%
Only Retailer I shop for all my needs: 15%
Retailer I want to shop the most: 8%
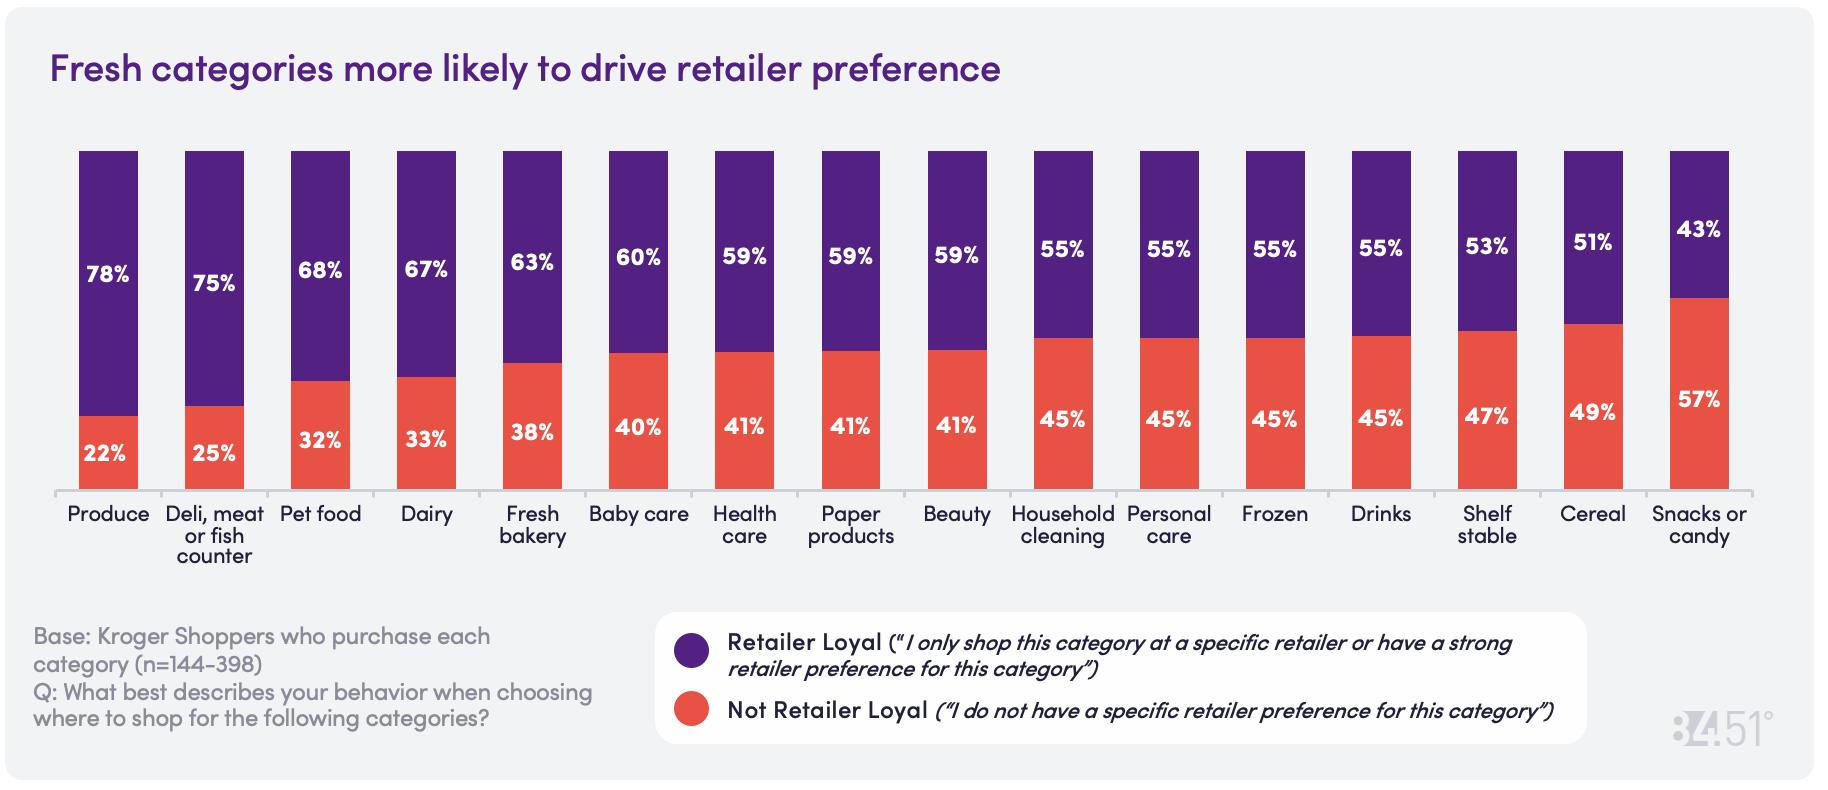
Category ‘retailer preference’ vs ‘brand preference’ within categories:
Top 5 categories with a strong specific ‘retailer preference’:
Produce: 78%
Deli/Meat/Fish Counter: 75%
Pet Food: 68%
Dairy: 67%
Fresh Bakery: 63%
Top 5 categories with a strong specific ‘brand preference’:
Pet Food: 70%
Drinks: 61%
Personal Care: 60%
Beauty: 59%
Dairy: 57%
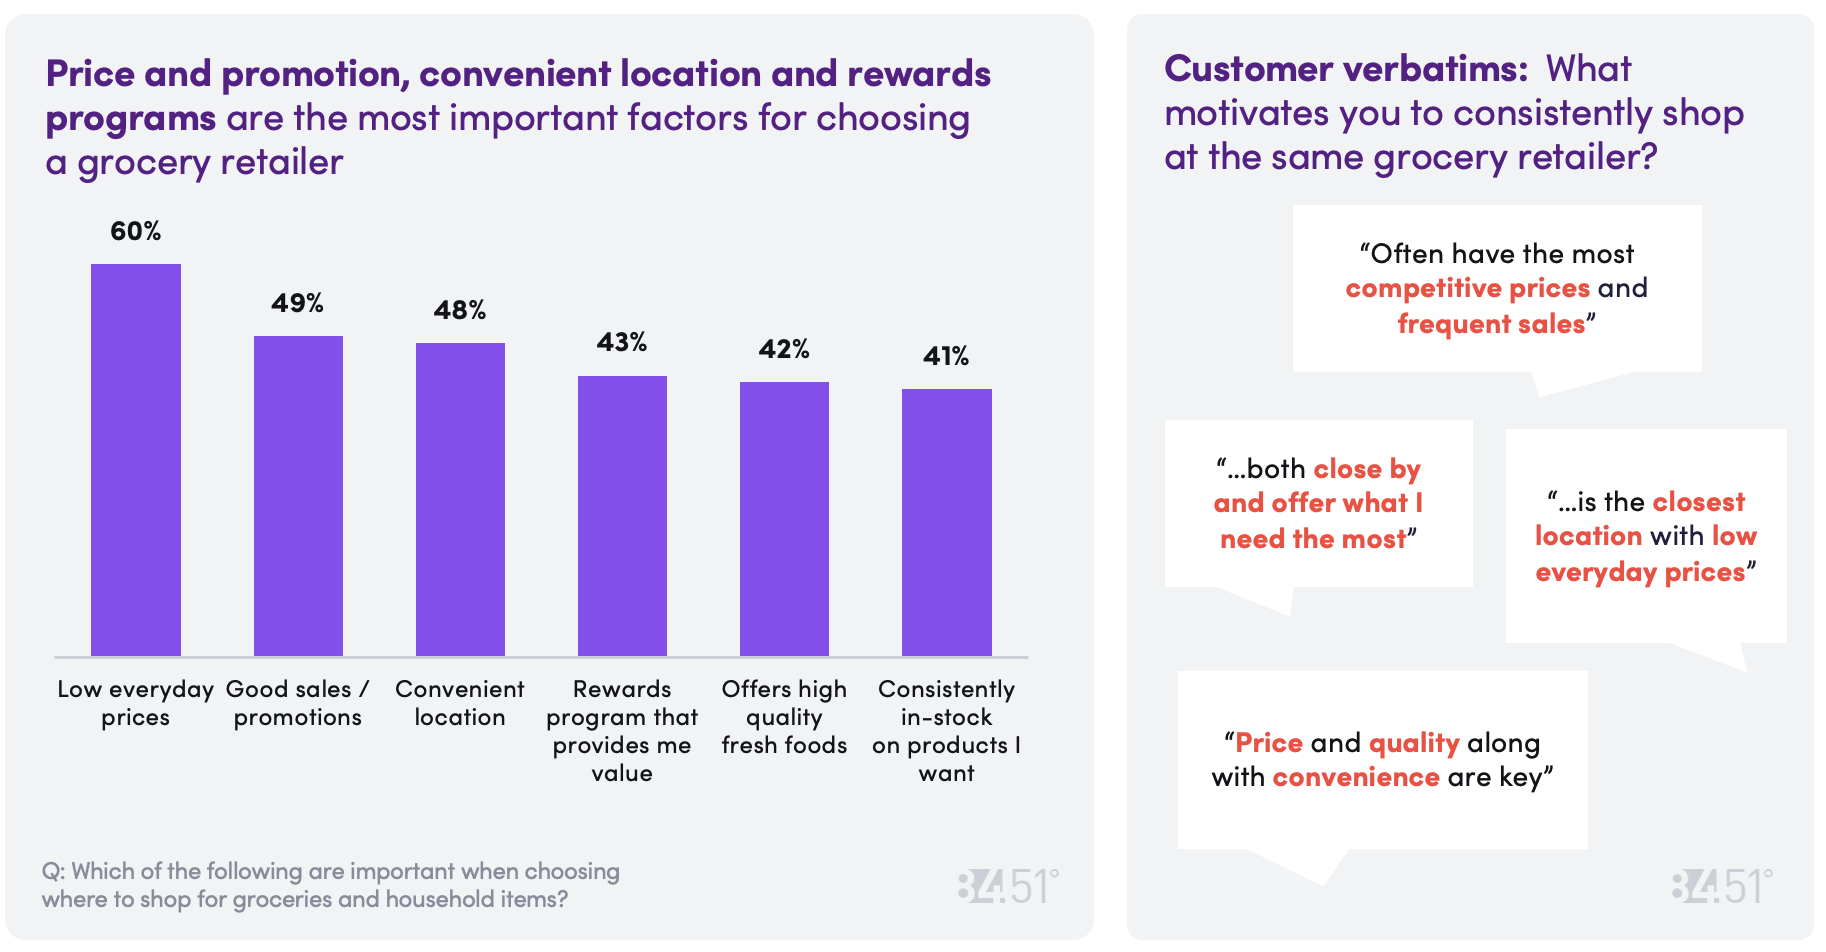
Retailer location and product assortment are the most important attributes of shopper’s preferred retailer (% T2B on 7-point agreement scale).
Is conveniently located near my home or workplace: 74%
Has wide variety of products and brands: 72%
Offers frequent sales and discounts: 64%
Offers competitive everyday pricing: 63%
Consistently offer high-quality products: 62%
Loyalty program provides discounts, rewards, or other benefits: 61%
How are shoppers engaging with coupons and discounts?
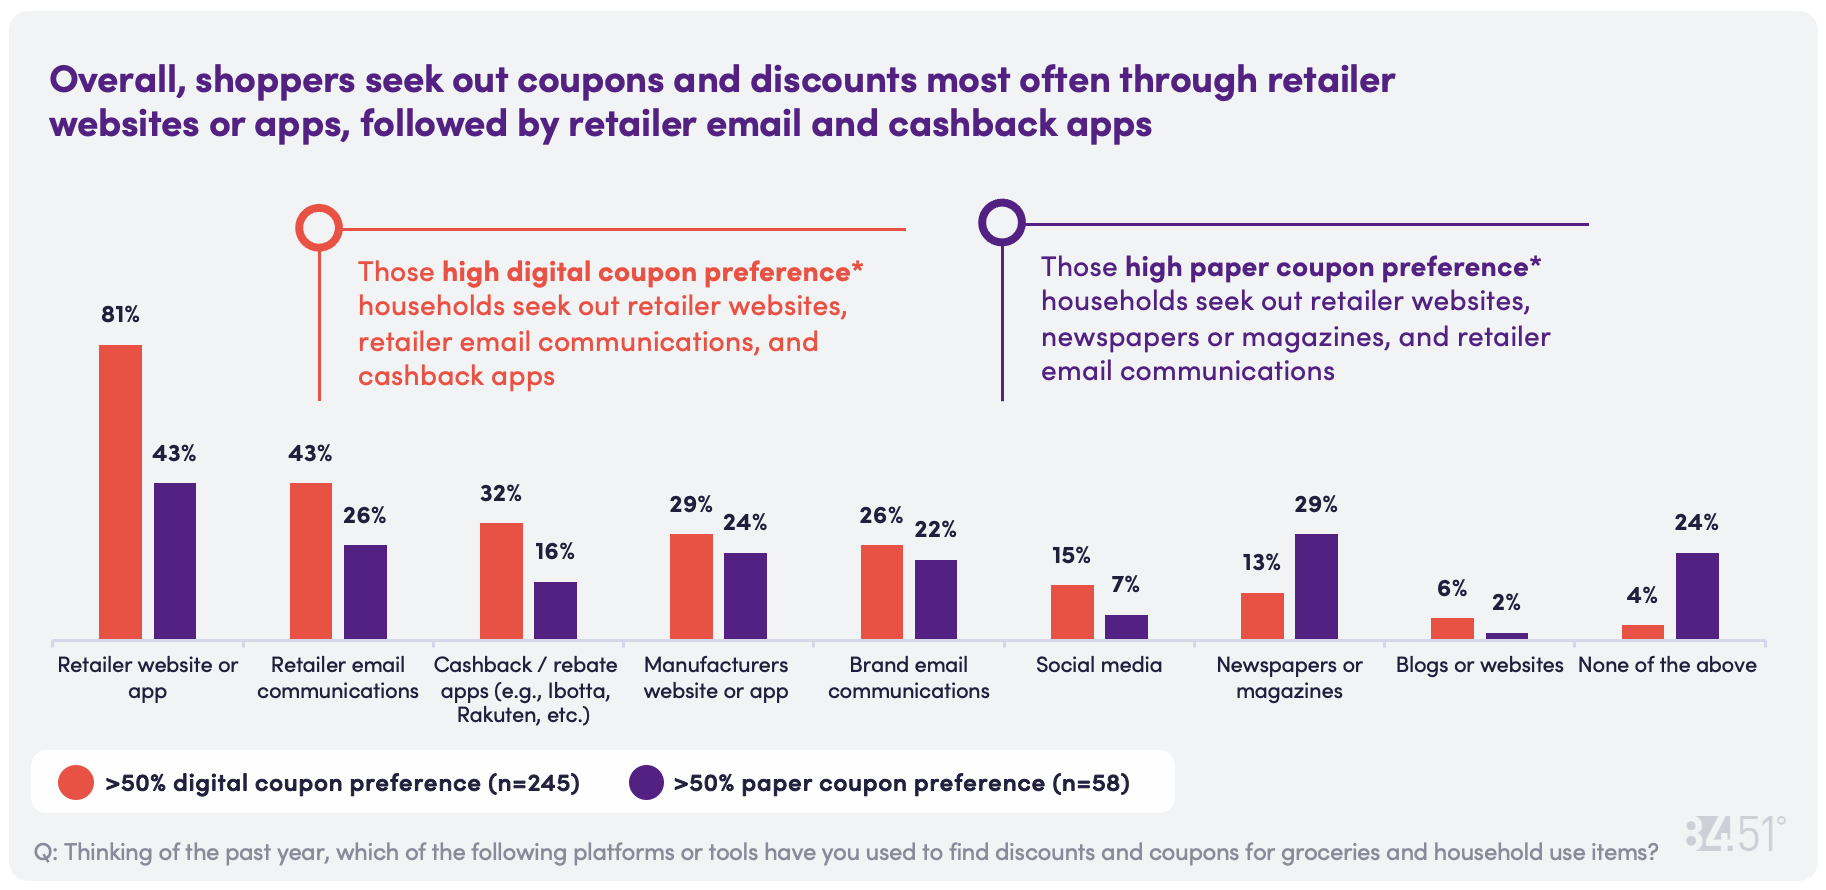
Shoppers are becoming more comfortable with technology with 30% of shoppers preferring to engage exclusively with digital coupons. Those preferring digital coupons exclusively don’t necessarily skew younger; the age ranges are broadly distributed.
Prefer a mix of both types of Coupons: 51%
Only Prefer Digital Coupons: 30%
Do not use coupons: 11%
Only Prefer Paper Coupons: 8%
Shoppers who prefer 100% Digital Coupons by Generation:
Millennial (28-43): 34%
Baby Boomer (60-78): 30%
Gen X (44-59): 28%
Gen Z (18-29): 24%
Source: 84.51° Real Time Insights Survey, August 2024
Visit our knowledge hub
See what you can learn from our latest posts.
