Consumer Digest: July 2022

Welcome to the July edition of the Consumer Digest, where we aim to provide relevant, informative and actionable insights around consumer trends. This month, we are doing an inflation deep dive. We’ll look at how consumers are feeling, what adjustments they are making, how inflation is impacting higher vs. lower income shoppers and what indulgences look like right now.
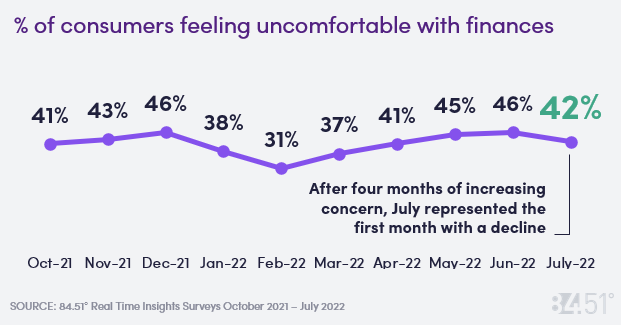
Finances Top of Mind This Summer
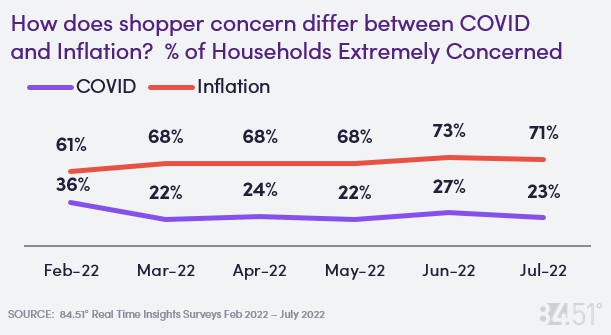
Financial pressures continue to drive more concern for households than COVID or safety related concerns.
Labor Department reported that Inflation hit +9.1% for L12M ending June 2022 while the cost of gasoline was up +59.9% June 2022 vs. June 2021.
The Fed has increased interest rates to help reduce demand and inflation with further increases possible later this month.
One positive indicator for the economy continues to be the low rates of unemployment, which has remained at 3.6% from March 2022 – June 2022.
47% of shoppers believe prices will remain higher for 1+ years, while 19% are not sure how long prices will remain high.
News of violence continues to be top of mind for many Americans, but shoppers largely feel safe while grocery shopping. 34% of shoppers feel extremely safe while grocery shopping while only 7% feel extremely unsafe related to violence.
How Shoppers Are Coping With High Prices
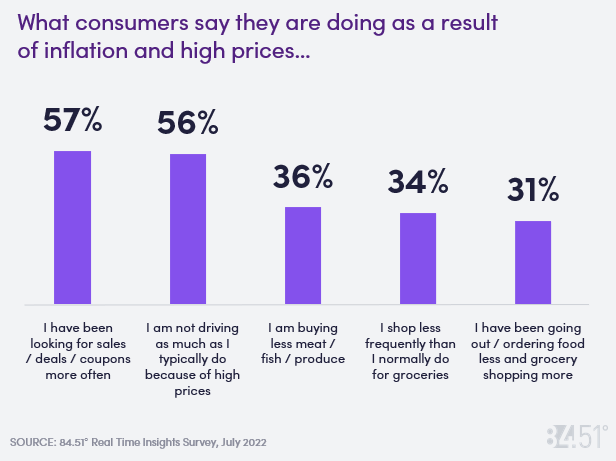
Shoppers continue to change their shopping behaviors as a result of inflation and high prices.
57% mentioned they have been looking for sales/deals/coupons more often, down vs. 63% last month.
56% are not driving as much due to high prices.
36% say they are shopping less frequently than they normally do for groceries. 34% of shoppers mentioned they are buying less meat / fish / produce vs. 33% from last month.
31% say they have been going out / ordering food less and grocery shopping more due to high prices down vs. 35% from last month.
Grocery Stores vs. Restaurants – Share of Stomach
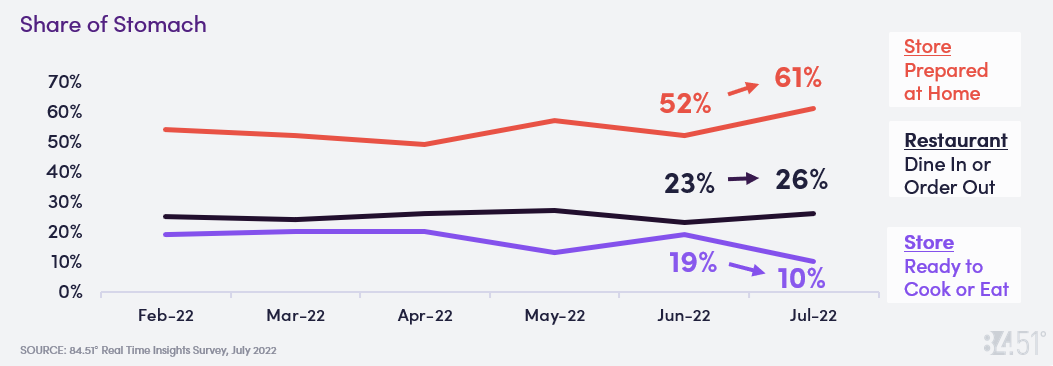
There has been an increase in preparing food at home (61% of food consumed in July vs. 52% in June) while consuming already prepared foods from the store has dropped off (10% of shoppers in July vs. 19% in June.)
Households eating from a restaurant (whether dining in or out) has remained steady over recent periods.
50% of households say they plan to eat out less often in the coming months while 43% do not plan to change their dining out frequency and 7% plan to increase.
Inflation Impacts on Higher Income vs. Lower Income Shoppers
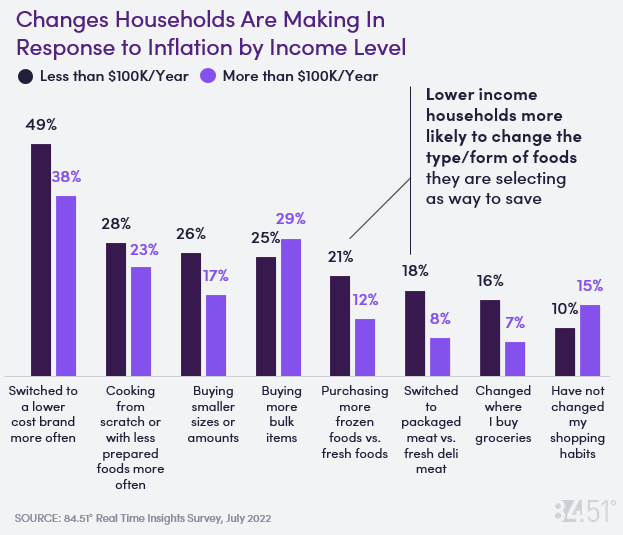
Lower income households are more likely overall to adjust their grocery shopping habits in response to inflation while higher income households are buying more bulk items and not changing their shopping habits.
Switching retailers is a less common behavior overall to help combat inflation, but more prevalent across lower income households.
Most households in both higher and lower income groups reported similar rates of cutting back in areas besides groceries (such as clothing, recreation, entertainment) with 60% of lower income and 54% of higher income.
How Shoppers are Indulging (or not!)
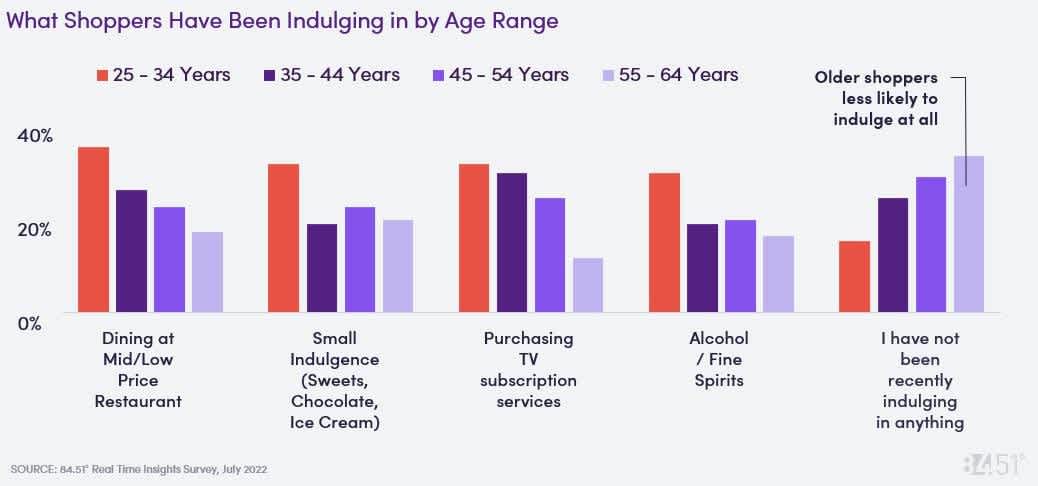
Older shoppers are much less likely to indulge during more challenging economic times compared to younger shoppers who are more likely to indulge by dining out, small treats, tv subscriptions and alcohol.
Trading Up or Trading Down at Breakfast
46% of consumers say they have switched to a lower cost brand more often, so how has this behavior come to life with breakfast occasions over the past year?
Premium coffee drinkers are looking for more value in their morning brew.
Shoppers who decreased their purchases of high-priced coffee brands generally switched to lower priced options.
Of all Premium coffee shoppers, 48% declined or left Premium Coffee, shifting their spend to lower priced brands.
Premium Breakfast Bar households are looking for lower cost options. Shoppers are leaving high price Breakfast Bars at a higher rate than low or medium price Breakfast Bars.
Of all breakfast bar shoppers:
30% left high priced Breakfast Bars
20% left lower priced Breakfast Bars
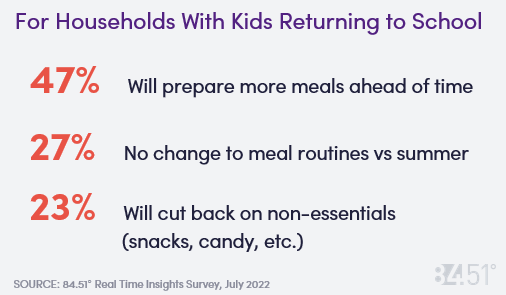
Back to School
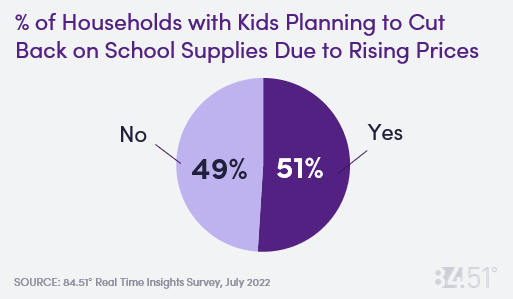
While majority of all households with kids returning to school are looking for ways to save during back-to-school, it is even more pronounced in households making <$50k/year, where 61% of these households are planning to cut back.
Summer Cocktails
While 30% say they do not have a favorite summer cocktail, the preferences differ widely across types of drinks ranging from Margaritas to Mojitos to Gin and Tonics. However, the top three winners are Margaritas, Pina Coladas and Daiquiris.
What are the favorite summer cocktails?
19% Margarita
9% Pina Colada
7% Daquiri
SOURCE: 84.51° Real Time Insights, July 2022
Visit our knowledge hub
See what you can learn from our latest posts.

![[DO NOT DELETE] 8451-PR header 4000x2000 shutterstock 2146084959 po](https://images.ctfassets.net/c23k8ps4z1xm/CUmZcselsJUhnLz6rQuj2/0e48394e72423bb1073bf8bb6cf75974/8451-PR_header_4000x2000_shutterstock_2146084959_po.jpg?w=328&h=232&fit=fill)