Consumer Digest: Holiday Insights September 2024

2024 Holiday Outlook
The National Retail Federation (NRF) forecasts that 2024 winter holiday spending is expected to grow between 2.5% and 3.5% over 2023, which is consistent with NRF’s forecast that annual sales for 2024 will be between 2.5% and 3.5% over 2023.
To get a preview of the next few months, we asked Kroger households about their preparations and attitudes for the holiday season October through December.
Updated 10/30/24 based on 10/15/14 NRF Report
96% of respondents plan to celebrate one or more upcoming holidays:
Halloween: 65%
Thanksgiving: 89%
Christmas: 91%
New Years Eve/Day: 69%
Shopper priorities: What are shoppers looking for while holiday shopping?
Sales/deals/coupons available: 71%
Availability of items: 70%
‘One-stop-shop’: 34%
Personalized shopping experiences (e.g., promos, rewards, support): 26%
Online ordering for delivery or pickup: 22%
Extended store hours: 19%
Vibe check: Top two responses around holiday spending show budget concerns (T2B):
My household is concerned about our budget when we think about holiday spending this year: 44%
My household plans to shop at stores that offer the steepest discounts during the holiday season: 43%
Anticipated holiday spending…91% of shoppers will spend the same or less compared to last year:
Spend more: 10%
Spend same: 54%
Spend less: 37%
Although shoppers are looking for ways to save, many will continue splurging on gifts and food:
Gifts: 44%
Food: 43%
Travel: 18%
Clothing: 17%
Holiday entertainment: 16%
Decorations/décor: 14%
Holiday parties: 12%
None of the above: 25%
Shoppers plan to do more low-cost activities and cut back on higher cost activities.
More:
Gather with friends/family: 31%
Watch holiday movies: 29%
Prepare for gatherings: 18%
Buy groceries: 18%
Decorate my house: 17%
Less:
Go out to restaurants: 52%
Spend money on entertainment: 39%
Travel: 31%
Consume alcohol: 28%
Donate to charities: 27%
Where will shoppers search for holiday deals?
Digital coupons: 75%
Weekly ads/circulars (paper or digital): 65%
Retailer’s website: 60%
Retailer app: 52%
Cashback apps/sites (e.g., Rakuten, Ibotta, etc.): 36%
Personalized paper coupons: 34%
By word of mouth: 27%
Manufacture’s website: 25%
% of shoppers who plan to let technology do some of the holiday planning:
For gift ideas: 21%
For new recipes: 21%
To make a grocery list: 20%
Discover new holiday traditions: 10%
To learn about holiday meaning/history: 9%
Plan a holiday trip: 9%
Top triggers to start holiday shopping:
Specific sales (Labor Day, Black Friday, etc.): 56%
Seeing holiday decorations/décor in-store: 31%
Family and friends starting their shopping: 30%
When do Kroger shoppers typically start planning for the fall/winter holidays?
Halloween: 47% plan 2 weeks – 1 month ahead
Thanksgiving: 59% plan 2 week – 1 month ahead
December Holidays: 63% plan 1-3 months ahead
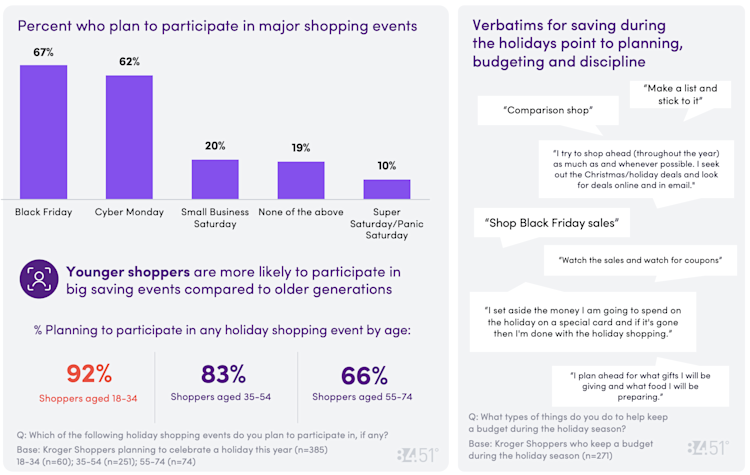
Holiday Sales Event Spotlight: Black Friday and Cyber Month, the two biggest events appeal to all generations, though with a skew to younger shoppers.
2024 Halloween Spotlight
Shoppers are sticking to the tried-and-true Halloween traditions and will make seasonal purchases to celebrate.
How shoppers are celebrating Halloween:
Decorating my house: 53%
Carving a pumpkin: 48%
Staying home & handing out candy: 43%
Stocking up on candy to give out: 36%
Stocking up on candy for myself/family: 36%
Going trick or treating in our neighborhood: 33%
Going to a trick or treating event: 27%
Going to a Halloween party: 26%
Going trick or treating in someone else's neighborhood: 23%
In-store shopping is favored for Halloween purchases
Where shoppers are planning to shop for Halloween:
Decorations:
Physical Mass Retailer: 43%
Physical Grocery Store: 33%
Will not be purchasing this year: 26%
Candy:
Physical Grocery Store: 62%
Physical Mass Retailer: 43%
Club Store: 23%
Costumes:
Will not be purchasing this year: 37%
Physical Mass Retailer: 25%
Online Mass Retailer: 19%
Say vs. Do: Halloween day is biggest for candy sales!
Shoppers are looking for deals and savings on candy, decorations and costumes. % of shoppers looking to cut back on Halloween supplies:
Candy: 37%
Decorations: 36%
Costumes: 30%
Food for gathering: 22%
Beverages for gathering: 22%
I do not plan to cut back on any Halloween supplies: 28%
2024 U.S Presidential Election Engagement and Outlook
To what extent are shoppers keeping up with the Election? (T2B, M3B, B2B on 7-point scale)
Extremely engaged: 34%
Moderately engaged: 57%
Extremely unengaged: 9%
Financial procrastination related to 2024 Election
The top 3 things shoppers are holding off doing until after the Election:
Holding off on buying a big-ticket item: 18%
Holding off on investment decisions: 15%
Holding off on purchasing a car: 13%
Are not holding off on doing anything until after the election: 53%
% of shoppers holding off on purchase decisions by age:
Shoppers 18-34: 62%
Shoppers 35-54: 44%
Shoppers 55-74: 42%
Source: 84.51° Real Time Insights Survey, September 2024.
Visit our knowledge hub
See what you can learn from our latest posts.


