Consumer Digest: Behavior Insights - Saving vs. Splurging August 2023

Welcome to the August edition of the Consumer Digest, where we aim to provide relevant informative and actionable insights around consumer trends. This month, we are exploring the dichotomy in purchase behavior – saving vs. splurging. We’ll look at shopper’s preferences around national brands and store brands, the top commodities shoppers say they are willing (and not willing) to switch to a store brand and the reasons why. Finally, we’ll wrap up with consumers’ plans for the upcoming football season.
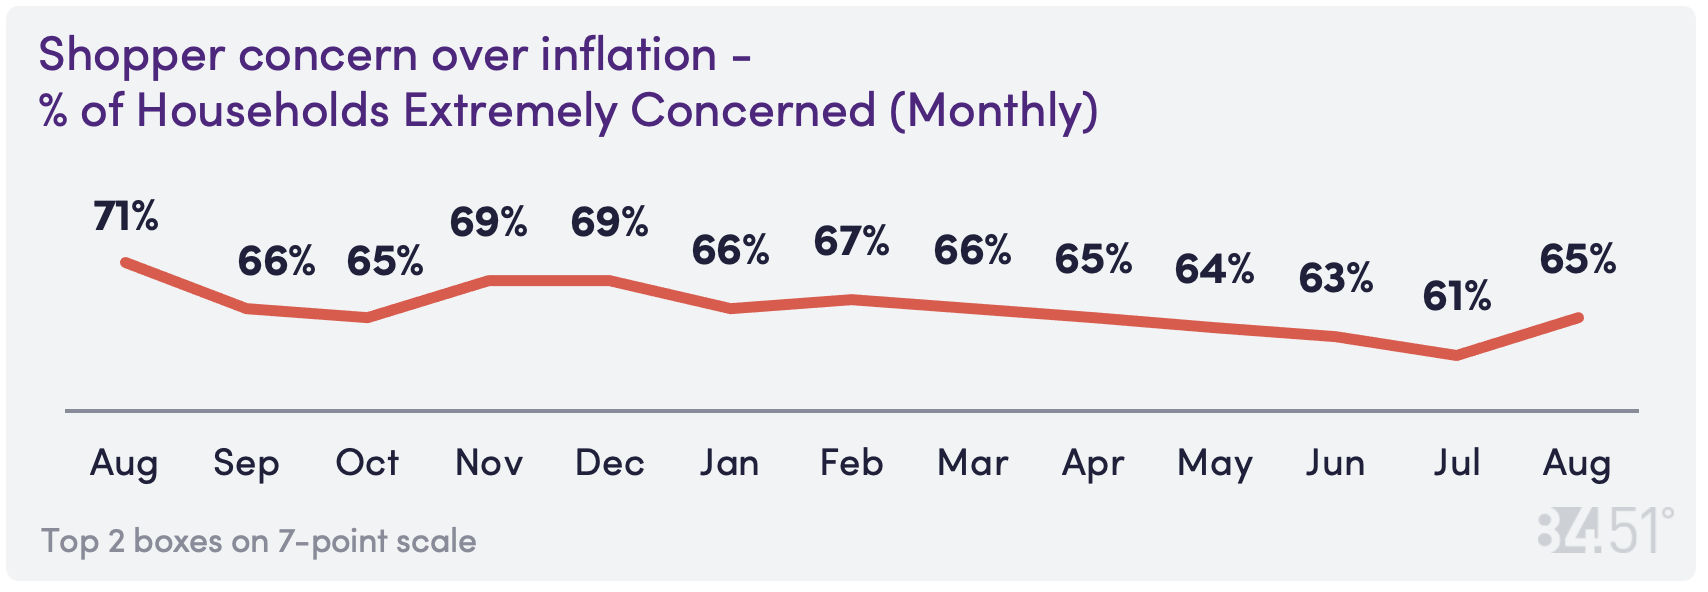
Inflation concerns are bouncing back
Shopper’s concern over inflation is back to Apr’23 levels after a three month-long decline.
Simultaneous splurging + saving in a challenging economy
Recent industry studies reveal a dichotomy in purchase behavior where consumers are looking for savings and pinching pennies due to inflation but still ponying up to spend on items they’re loyal to, passionate about or just generally prefer for a variety of reasons. These items seem to be immune to the trade down trend that’s been taking place as CPI has skyrocketed over the past two years.
Using the 84.51° Stratum and Real Time Insights platforms, we set out to learn more about this phenomenon - what is and is not immune to the trade down trend.
National vs. store brand preferences
8% Prefer National Brand
29% Prefer National Brands but open to Store Brands
17% No specific Brand preferences
16% Prefer Store Brands but open to National Brands
31% Prefer Store Brand
Top commodities shoppers are willing to switch to store brands
Frozen +3.8%
Shelf Stable +1.7%
Household Cleaning -2.6%
Healthcare (OTC) +2.7%
Top reasons why: willing to switch to store brands
Quality is just as good
Store Brands offer variety/selection that meets my needs
Store Brands offer product size(s) that meets my needs
Top commodities shoppers are not willing to switch to store brands
Pet +2.7%
Personal Care +0.04%
Beauty +7.4%
Drinks +2.1%
Top reasons why: not willing to switch to store brand
Quality is not as good
I always buy some national brands I like
Store Brands do not offer the variety or selection that meets my needs
Retail therapy & permissible pleasures
The top 10 items shoppers purchase with the intent to treat themselves...
Candy
Baked Goods and Treats
Snacks
Ice Cream
Self-Care Products
Beverages
Hair Care Products
Name Brand Products
Cheese
Makeup
And what exactly motivates the “treating”?
Taste
Price/Sale
Cravings
Reward/Treat
Quality/Experience
Moods/Emotions
Good Deals
Packaging/Product
Nostalgia/Preference
Money/Budget
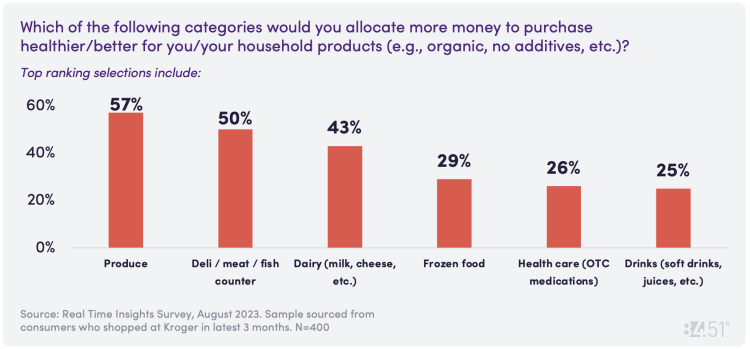
Spending on “better for you” products
Thinking of budgeting when shopping for groceries or household items, we asked:
Motivations pyramid
To dig a little deeper and get an understanding on the “why” related to budgeting for healthier/better for you/your household products (e.g., organic, no additives, etc.), we asked: What motivates you to allocate more money for purchasing those products?
Highest ranking responses submitted from open-ended questions in order:
Health
Quality
Better for the Body
Saving Money
Motivation
Necessity
Family
Organic
Healthier Options
Cleaner & Better for the Environment
Are you ready for some football?!?
With football season upon us, we asked consumers if they are planning to watch or attend any football games (e.g., pro, college, high school). Numbers exceed 100% due to multi-select responses.
85% Plan to watch games at home, host a party at home or watch at someone else’s home.
25% Plan to attend games in person (in or out of town).
21% Plan to go out to watch the games.
What kinds of pre-game activities consumers plan on attending during the football season, if any. Numbers exceed 100% due to multi-select responses.
43% Gatherings at my house
38% Gatherings at someone else’s house
28% Plan to gather at an establishment(e.g., sports bar, local pub, restaurant)
19% Plan to gather near/at the stadium (e.g., tailgating in the lot)
Top items shoppers are planning to purchase in a traditional grocery store for upcoming pre-game activities:
Chips/Pretzels
Soft Drinks
Dips/Salsas
Alcoholic Beverages
Hot Dogs/Brats/Sausages
Paper Products/Plates/Napkins
Cheese Snacks
Condiments
Fresh Meat
Prepared Meat (rotisserie chicken)
Want to dig deeper?
Each month. 84.51°’s Consumer Digest Report delivers relevant and actionable insights around consumer trends directly to your inbox. Now, for an incremental investment, 84.51° invites you to explore these insights the way you want via the 84.51° Consumer Digest Dashboard.
SOURCE: 84.51° Real Time Insights, August 2023
Visit our knowledge hub
See what you can learn from our latest posts.


