Consumer Digest: Back to School Shopping July 2024

How do shoppers engage with artificial intelligence for grocery shopping?
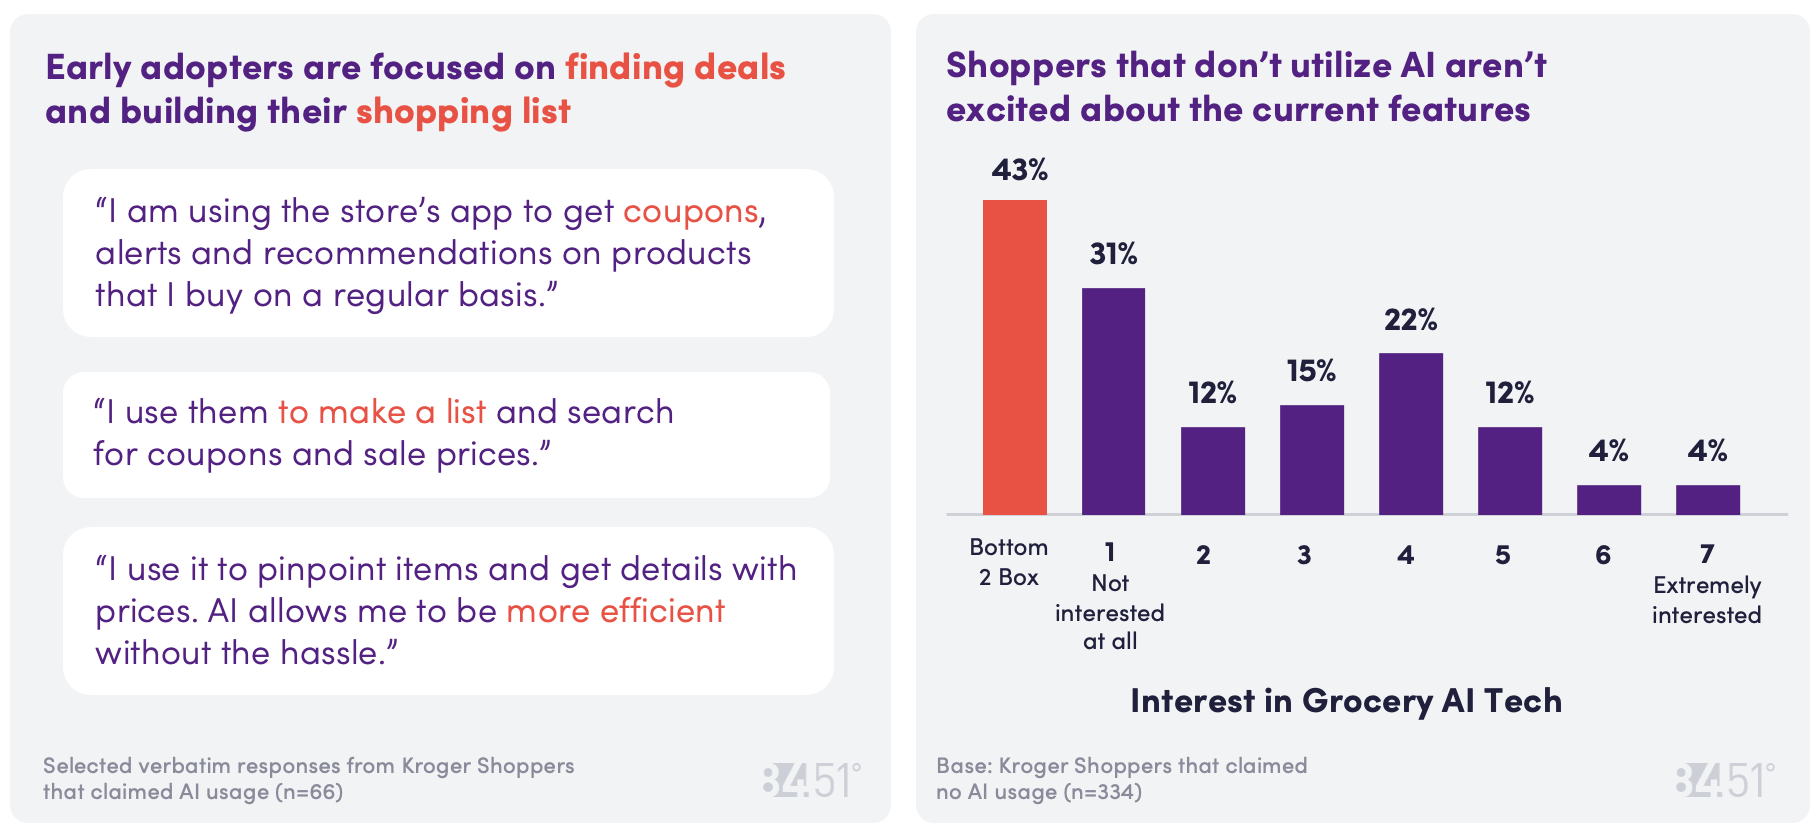
There is growth opportunity for AI in grocery, with only 17% of shoppers currently using AI tools. These “early-adopters” use these tools before, during, and even after their shopping trips.
Do you currently use AI when shopping?
Does not use AI: 74%
Uses AI: 17%
Unsure: 10%
When do shoppers use AI tools?
Before shopping: 93%
While shopping: 82%
After shopping: 57%
Shoppers who do not currently use AI are looking for features that help them save time and money.
Find sales/deals/coupons on items: 71%
Comparing prices across retailers: 58%
Building your shopping list: 44%
Meal planning/suggesting/ingredients for meals: 42%
I scream, you scream, we all scream for Ice Cream!
National Ice Cream month celebrates their 40th anniversary in July. In 1984, President Ronald Regan declared July as National Ice Cream month and established National Ice Cream Day as the 3rd Sunday in July. Below are some consumer trends for this savory and flavorful category!
How are shoppers consuming Ice Cream vs. a year ago?
Do: Ice cream sales are relatively flat, up roughly 1% compared to the same period last year primarily driven by increases in dollar sales per unit and per trip.
Say: Consumers state that compared to last year:
Eating the same amount: 53%
Eating less: 28%
Eating more: 16%
Personal budget ranks as the highest influence decreasing Ice Cream consumption:
Budget: 57%
Poor value due to reduced quantity: 40%
Need to eat healthier: 38%
Lifestyle changes: 27%
Changes in diet: 20%
Shrinkflation: 20%
Nationally, ice cream consumption remains flat, however, some parts of the country are seeing slight shifts in trends.
Ice cream sales in dollars vs. Units
The data shows shoppers spend more when purchasing ice cream, but they purchase more units per trip when shopping online for pickup or delivery.
Money-saving moves for purchasing ice cream
Of the non-traditional types of ice cream, here’s what garners the most interest
Gelato: 29%
Frozen Yogurt: 28%
Sherbert: 26%
Sorbet: 25%
Frozen Custard: 24%
Dippin’ Dots: 20%
Size and Seasonality
Premium is the most popular type of Ice Cream across all generations.
Fourth of July, Thanksgiving and Christmas are holidays that experience major spikes in ice cream dollar sales over the past 52 weeks.
76% of the back-to-school shoppers have not yet started (as of 7/9/24)
Have not started back-to-school shopping: 76%
Have started back to school shopping: 24%
Don’t plan to participate in back-to-school shopping: 55%
Plan to participate in back-to-school shopping: 45%
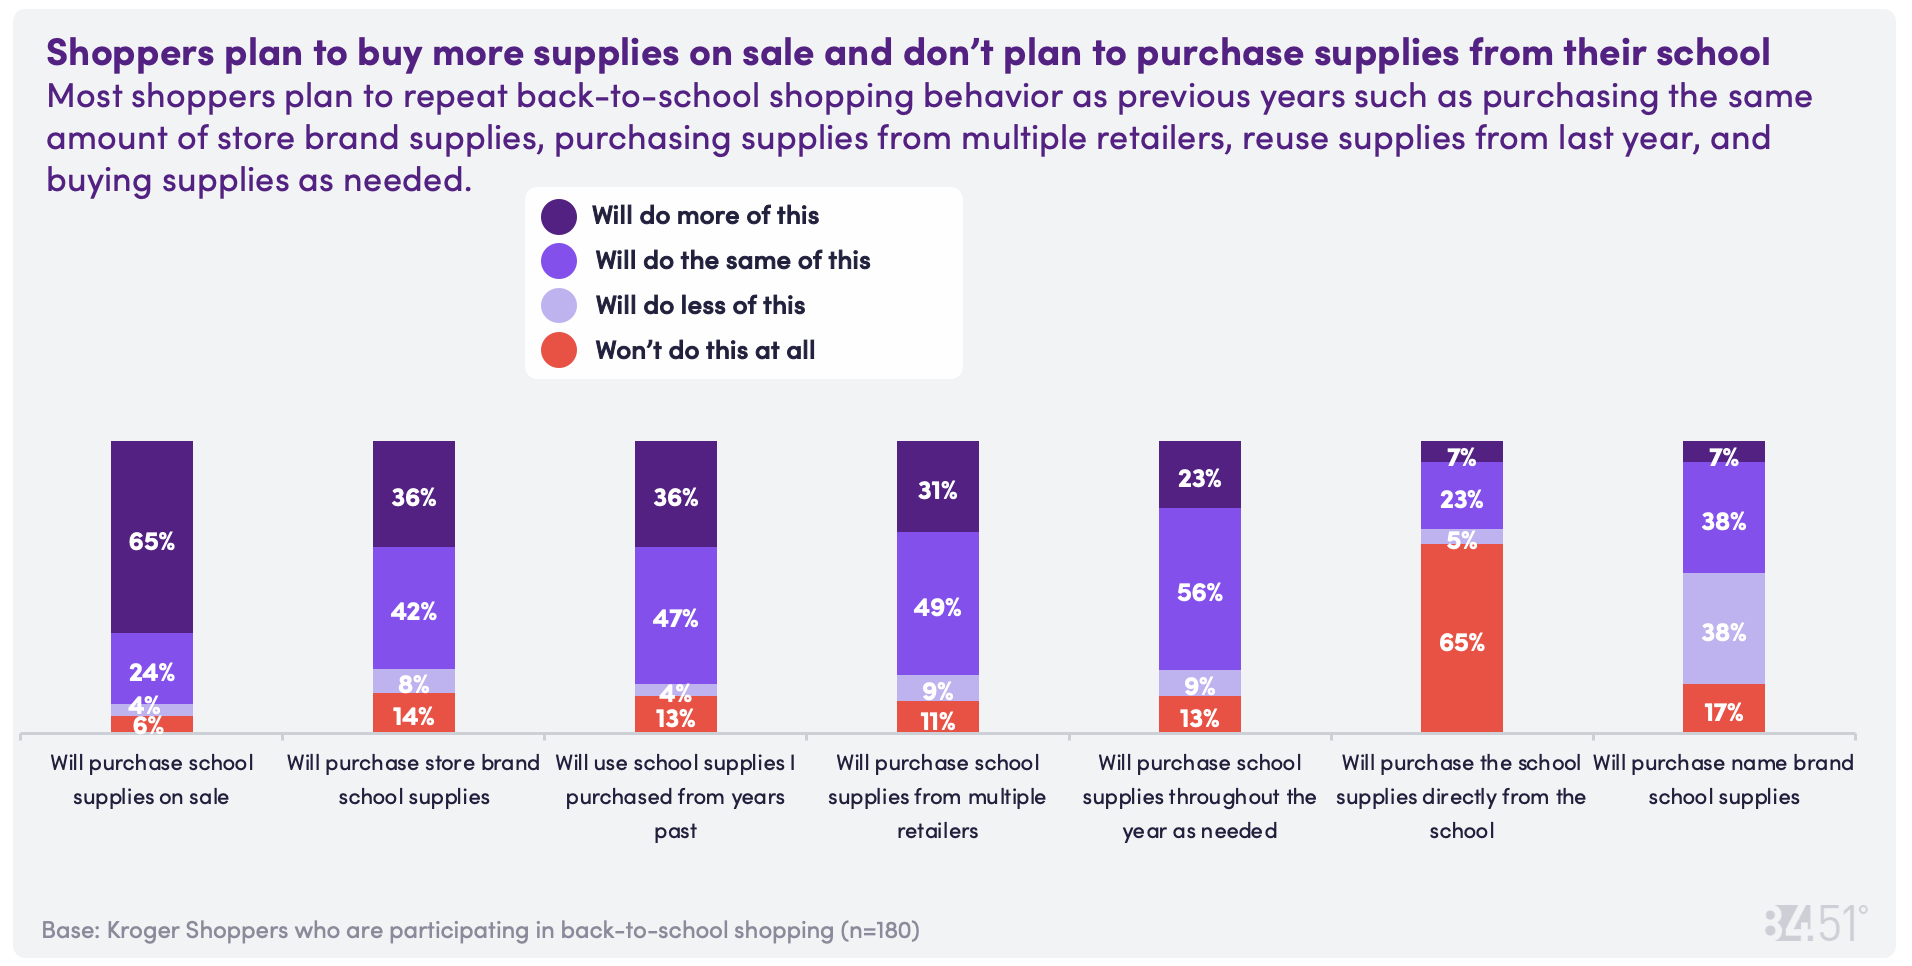
Good prices, sales and finding value are what’s on the back-to-school shoppers’ lists
Shoppers’ top 3 most important aspects of shopping for back-to-school supplies:
Finding supplies within budget: 31%
Finding supplies on sale: 24%
Finding supplies on list: 21%
Value Drivers: Shoppers ranked what’s most important for getting a good value:
Price/Affordability: 46%
Quality: 19%
Durability: 12%
SOURCE: 84.51° Real Time Insights, July 2024
Visit our knowledge hub
See what you can learn from our latest posts.


