The challenges and dangers of causally interpreting machine learning models

Data scientists are often interested in or tasked with deriving causal insights from machine learning (ML) models. This is especially tempting given the increasingly advancing field of interpretable machine learning (IML). In this post, we’ll discuss some of the challenges and dangers of attempting this without both strong domain expertise and the use of appropriate causal tools, like DAGs (directed acyclic graph). We’ll also briefly discuss some current approaches to injecting causal knowledge into ML models to help make them more explainable and safer to deploy.
Introduction
Teams are often tasked with building and deploying machine learning models for the primary purpose of generating inference in a production environment (e.g., determining what coupons to send to which households, or generating predictions that feed into a later optimization process). In many cases, teams are further interested in or even asked by the business to answer causal questions, such as identifying causes and effects, predicting the effect of an intervention, and answering counterfactual (i.e., what-if) questions. While answers to such questions are certainly valuable to the business, standard ML techniques are not designed to answer causal questions.
For illustration, we’ll rely on a simulated example inspired by this Medium article from Scott Lundberg, Eleanor Dillon, Jacob LaRiviere, Jonathan Roth, and Vasilis Syrgkanis. For a more detailed example with Python code, see the simulated subscriber retention example, which can be found tucked away in the shap user documentation.
What could go wrong?
Suppose your team is tasked with developing a model to predict some binary outcome Y (e.g., whether an existing customer will redeem an offer that was sent to them). Your team has worked hard to identify the following relevant features: X1, X2, X3, and X4 (this is an overly simplistic example and in real life you’d likely be dealing with a lot more variables).
A simplified, but typical ML project pattern would be to fit an XGBoost (or other relevant ML model) and then, before hitting production, study the “important” features to understand how each one impacts the model. Oftentimes, these understandings are often misinterpreted as being causal rather than simply explanations of the model’s inference.
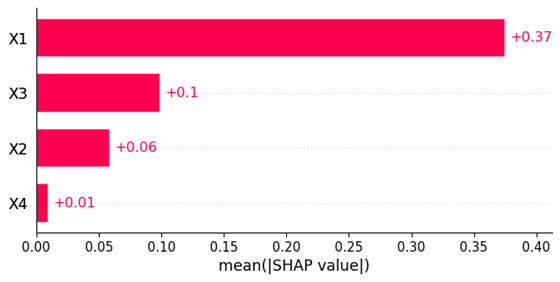
To illustrate this, we trained an XGBoost model using a 10,000-row sample based on simulated data of which we know the underlying distributions and causal effects. Figure 1 displays the SHAP-based feature importance scores for the model (a common IML technique). Here we can see that X1 is the most relevant variable to the model, followed by X3 and X2, with X4 having little-to-no importance at all.
Figure 1. SHAP-based variable importance plot showing which features are most relevant to the ML model.
Figure 2 shows the effect each feature has on the model’s predicted output (blue points); ignore the black curves for now. Notice how X1 appears to have a strong negative effect on the model’s predictions (i.e., increasing X1 while holding the other variables constant tends to lead to a decrease in the model’s predicted output). Similarly, X3 shows a positive relationship with the predicted outcome. In contrast, X4 displays a relatively flat relationship with the predicted outcome, which is consistent with its low importance from Figure 1.
Figure 2. SHAP-based dependence plots showing the impact each feature has on the ML model.
What’s the issue?
It’s important to understand that the SHAP-based variable importance and dependence plots from Figures 1–2 are true to the model as opposed to true to the data. In other words, these IML techniques are merely describing how each feature impacts the model’s predictions, and not the underlying outcome in the real world. This means that implementing business actions based on these described model relationships is not guaranteed to produce the effect in outcome that the model predicts.
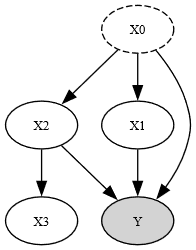
Take into consideration the simple directed acyclic graph (DAG) in Figure 3, which summarizes the true causal mechanism from which the sample data were generated (i.e., directional arrows show which variables affect each other in a causal way)). In this case, we can see that both X1 and X2 are influenced by an unobserved confounder, X0, that is not included in our model. Furthermore, while both X1 and X2 have a direct impact on the response, X3 is completely independent of the outcome Y. However, since X2 influences both X3 and Y, it naturally creates a correlation between X3 and Y that the ML model can exploit for prediction; this is why the SHAP-based effect plot (Figure 2) for X3 shows a positive relationship instead of being flat (i.e., no relationship)…because it’s merely summarizing the correlation/association between X3 and Y and not any underlying cause-and-effect relationship (correlation does not imply causation).
Figure 3. DAG representing the true causal relationships between the variables in our simulated data example.
You can see how causally interpreting these results can lead to poor decision making. For instance, suppose X3 represents something tied to dollars (e.g., ad expenditure or marketing efforts). A stakeholder may see the positive association (blue points) for X3 in Figure 2 and mistakenly think that increasing X3 will lead to an increase in Y. But this is not the case as indicated by the fact that X3 and Y are completely independent (i.e., no causal relationship). A business stakeholder who acts upon this will not see the desired outcome in Y and will have wasted resources based on faulty information. This is similarly true for X1, for which the model captured a negative association with Y compared to the true positive causal effect (black curve).
What to do instead
While DAGs are great for summarizing domain expertise, they also help determine which variables to control (and not control) for when trying to estimate causal effects. For instance, DoubleML, a recently popular technique that uses ML to estimate average causal effects, still requires knowledge of which features need to be accounted for (or not accounted for) in the underlying ML models; information that’s easily obtainable from a given DAG. Of course, all of this hinges on the accuracy of the proposed DAG, which is often unverifiable.
There have also been attempts to understand when traditional IML techniques can indeed be interpreted in a causal context; the interested reader is pointed to the article Causal Interpretations of Black-Box Models. The methods proposed in this article still require the same knowledge that’s captured in a well thought out DAG. Hence, regardless of the types of causal questions you’re trying to answer and the tools you’re using, there’s no getting around the need for strong domain knowledge and some way to capture the necessary assumptions required to answer these types of questions, and DAGs are immensely useful for capturing this information.
Lastly, it’s worth mentioning that DAGs can be hard to construct in high-dimensional problems (e.g., lots of variables). But not all hope is lost in such cases. ML and IML can still be used to generate interesting hypotheses that can be tested or confirmed with randomized control trials (RCTs). While RCTs are not as common in certain industries (e.g., due to ethical concerns or cost) they are still widely used and considered to be the gold standard for understanding potential cause and effect relationships. Richard De Veaux, a well-known statistician, once spoke of a consulting project where they were tasked with determining the cause of cracking in $30,000 ingots. Armed with >90 variables and historical data for modeling, they trained a simple ML model to understand which variables seemed most important in predicting a higher cracking rate. This led to an a small and efficient RCT that was able to confirm the reason for cracking. In this case, traditional ML and IML provided clues about the causal mechanism that could be easily tested.
Other research/resources
There are several popular tools to aid in generating DAGs, testing causal assumptions, suggesting covariate adjustment sets, and estimating causal effects. These include DAGitty, DoWhy, and EconML (the latter two being part of the broader PyWhy ecosystem).
With all the current emphasis and on-going research in generative AI (GenAI), it’s no surprise that efforts have been made to use GenAI to derive potential causal relationships and even entire DAGs. While LLMs can be a useful aid to help get started, we strongly caution any data scientist from relying too much on such methods; inferring causality is not something that is able to be automated and will always require strong domain expertise.
Discussion
Causal inference can never be automated and strong domain expertise will always be needed in any attempt to understand the causal mechanisms of a data generating process. With the right knowledge and tools, data scientists will be better equipped to answer (or not answer) causal questions for the business.
Visit our knowledge hub
See what you can learn from our latest posts.


